In Brief: XRP’s tightening weekly Bollinger Bands resemble previous four-year cycles, raising expectations of another prolonged consolidation period within established trading ranges. CoinGla
In Brief:
- XRP’s tightening weekly Bollinger Bands resemble previous four-year cycles, raising expectations of another prolonged consolidation period within established trading ranges.
- CoinGlass data shows XRP open interest near $3.1 billion, while the Relative Strength Index of 44 indicates weak directional momentum.
- XRP faces resistance around $1.50 and $1.59, while buying activity near $1.30–$1.34 supports prices against further downward pressure.
XRP’s weekly chart indicates another potential consolidation cycle as tightening Bollinger Bands mirror patterns recorded during two previous trading periods. The cryptocurrency remains between $1.30 and $1.59, with elevated derivatives activity failing to generate sustained directional momentum.
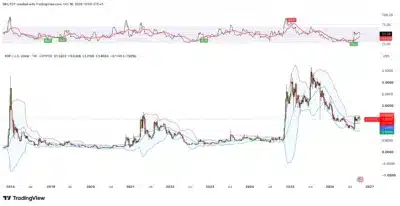
According to TradingView data, similar technical conditions emerged during earlier periods when XRP experienced prolonged sideways price movement. The recurring structure has drawn attention to the possibility of another extended consolidation phase.
Also Read: Shiba Inu Volume Hits 1.34 Billion SHIB as Price Struggles to Recover From Market Crash
XRP’s Historical Four-Year Pattern Signals Prolonged Consolidation
Historical price charts show two major consolidation periods: September 2018 to November 2020 and September 2022 to November 2024. Both periods involved approximately two years of restricted trading activity, with limited movement beyond established price boundaries.
Similarly, XRP’s current weekly chart shows Bollinger Bands narrowing as volatility declines across the broader trading range. This contraction reflects reduced price fluctuations, although the indicator cannot determine how long consolidation might persist. Meanwhile, derivatives data highlights a notable difference between previous cycles and current market conditions.
Source: TradingView
According to CoinGlass, XRP’s open interest stands near $3.1 billion, reflecting substantial outstanding derivatives positions despite limited price movement. Earlier consolidation periods generally saw declining market participation as traders reduced exposure during extended uncertainty.
Current positioning remains elevated, suggesting greater derivatives participation compared with historical consolidation phases. Additionally, XRP’s Relative Strength Index stands at 44, indicating subdued momentum without establishing a clear directional trend.
XRP Faces Resistance at $1.50 as Support Holds Near $1.30
Price action identifies immediate support between $1.30 and $1.34, where buying activity has repeatedly restricted further declines. Conversely, resistance around $1.50 has limited recovery attempts, while $1.59 represents the broader range’s upper boundary.
Repeated reversals within these levels have created difficult conditions for leveraged traders expecting sustained price movements. Significantly, elevated open interest indicates substantial outstanding exposure, although available figures do not establish the distribution between long and short positions.
A sustained breakout beyond either boundary would represent a meaningful change in XRP’s current technical structure. Overall, XRP’s compressed Bollinger Bands and elevated open interest resemble earlier consolidation conditions, while historical patterns cannot guarantee another two-year cycle.
Also Read: What We Know About the $86 Million Ledger Drain So Far
The post XRP’s Four-Year Pattern Returns as $3.1 Billion Open Interest Signals Extended Consolidation appeared first on 36Crypto.