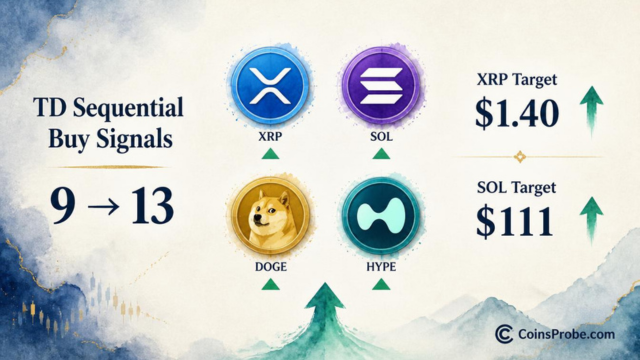
Key Highlights XRP prints TD Sequential S13 + TD9 + A13 confluence near $1.317 — analyst targets $1.40 then $1.50 resistance trendline SOL buy TD9 appears at $103.10 after prior sell TD9 on s
Key Highlights
XRP prints TD Sequential S13 + TD9 + A13 confluence near $1.317 — analyst targets $1.40 then $1.50 resistance trendline
SOL buy TD9 appears at $103.10 after prior sell TD9 on same chart delivered exact -13.98% decline
HYPE prior TD9 signal (Oct 1) produced +10.65% rally — second buy signal now active near $80.16
DOGE TD9 buy at $0.080 horizontal support — first target $0.087, trendline resistance $0.094
XRP is trading at $1.31, down 3.86% in the past 24 hours, with a market cap of approximately $82.85 billion — and four major crypto assets have simultaneously printed a rare confluence of TD Sequential exhaustion signals on their daily charts. The signal does not guarantee a reversal. It does quantify that sellers have been in control for long enough that momentum exhaustion is statistically measurable across multiple independent markets.
Crypto analyst Ali Martinez (@alicharts) posted a six-part thread on October 15, 2026, flagging TD Sequential buy signals on XRP, Solana, Dogecoin, and Hyperliquid in close succession. “Together, they suggest a local bottom may be forming,” Martinez writes. “If buyers step in, I’m watching for a rebound toward $1.40, then the resistance trendline.” The thread covers all four assets using only chart-based TD Sequential readings — no on-chain metrics or macro indicators are cited.
Before citing readings: the TD Sequential, developed by Tom DeMark, counts consecutive closes in the same direction to identify momentum exhaustion — not a price level and not a directional guarantee. A “9” signal marks nine consecutive closes lower, flagging that selling pressure may be statistically overextended. A “13” (Sequential 13 or Aggressive 13) is a further countdown that deepens the exhaustion reading. Multiple signal types appearing simultaneously — a Sequential 13, a TD 9, and an Aggressive 13 — represent a confluence that Martinez identifies as stronger than any single reading in isolation.
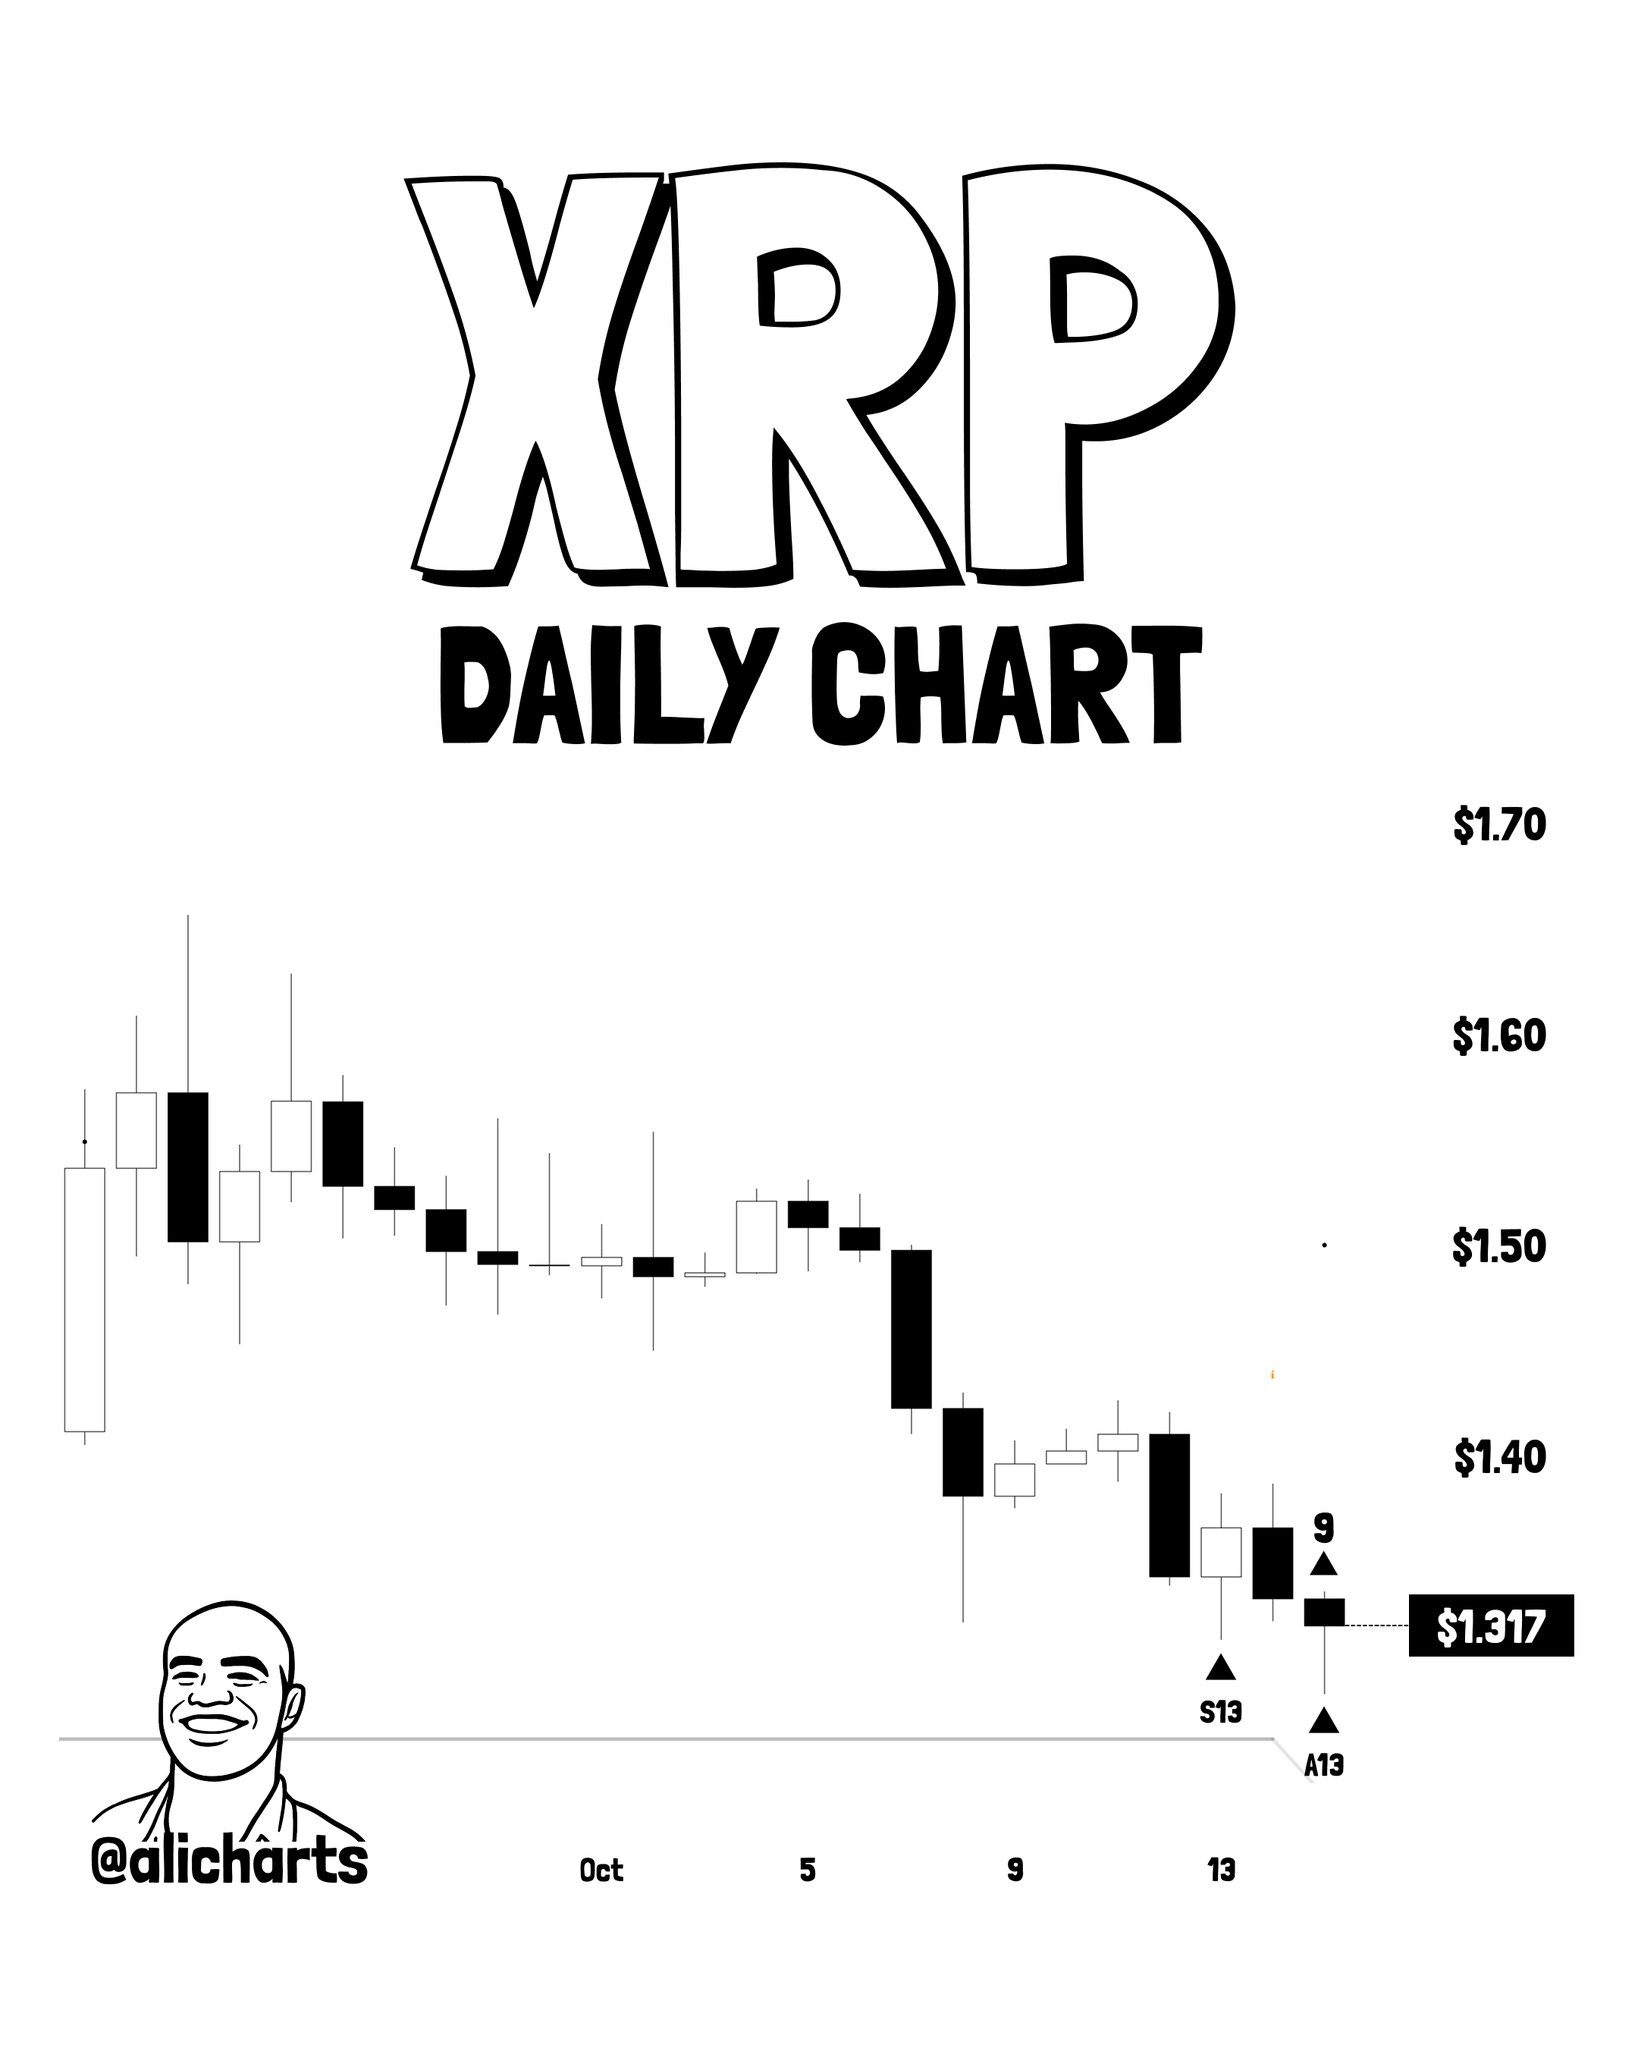
The daily XRP chart shared by Martinez shows a sustained downtrend from late September through October 13, with three TD Sequential exhaustion markers clustered at the lows: an S13 (Sequential 13), a standard TD 9, and an A13 (Aggressive 13), all printing near the $1.317 chart price label. This is the most notable confluence in the thread — three distinct buy-signal types appearing within the same price zone after a prolonged bearish sequence is statistically uncommon on any single timeframe. Martinez’s stated first target is $1.40, with the resistance trendline at $1.50 as the secondary level. XRP has recently seen significant whale activity — XRP whales accumulated $2.2B in 96 hours in a prior window, and the asset completed an inverse head-and-shoulders with $2B in whale additions — meaning the technical exhaustion signal emerges against a backdrop of documented large-holder interest.
XRP Daily Chart Analysis | Source: @alicharts (X)
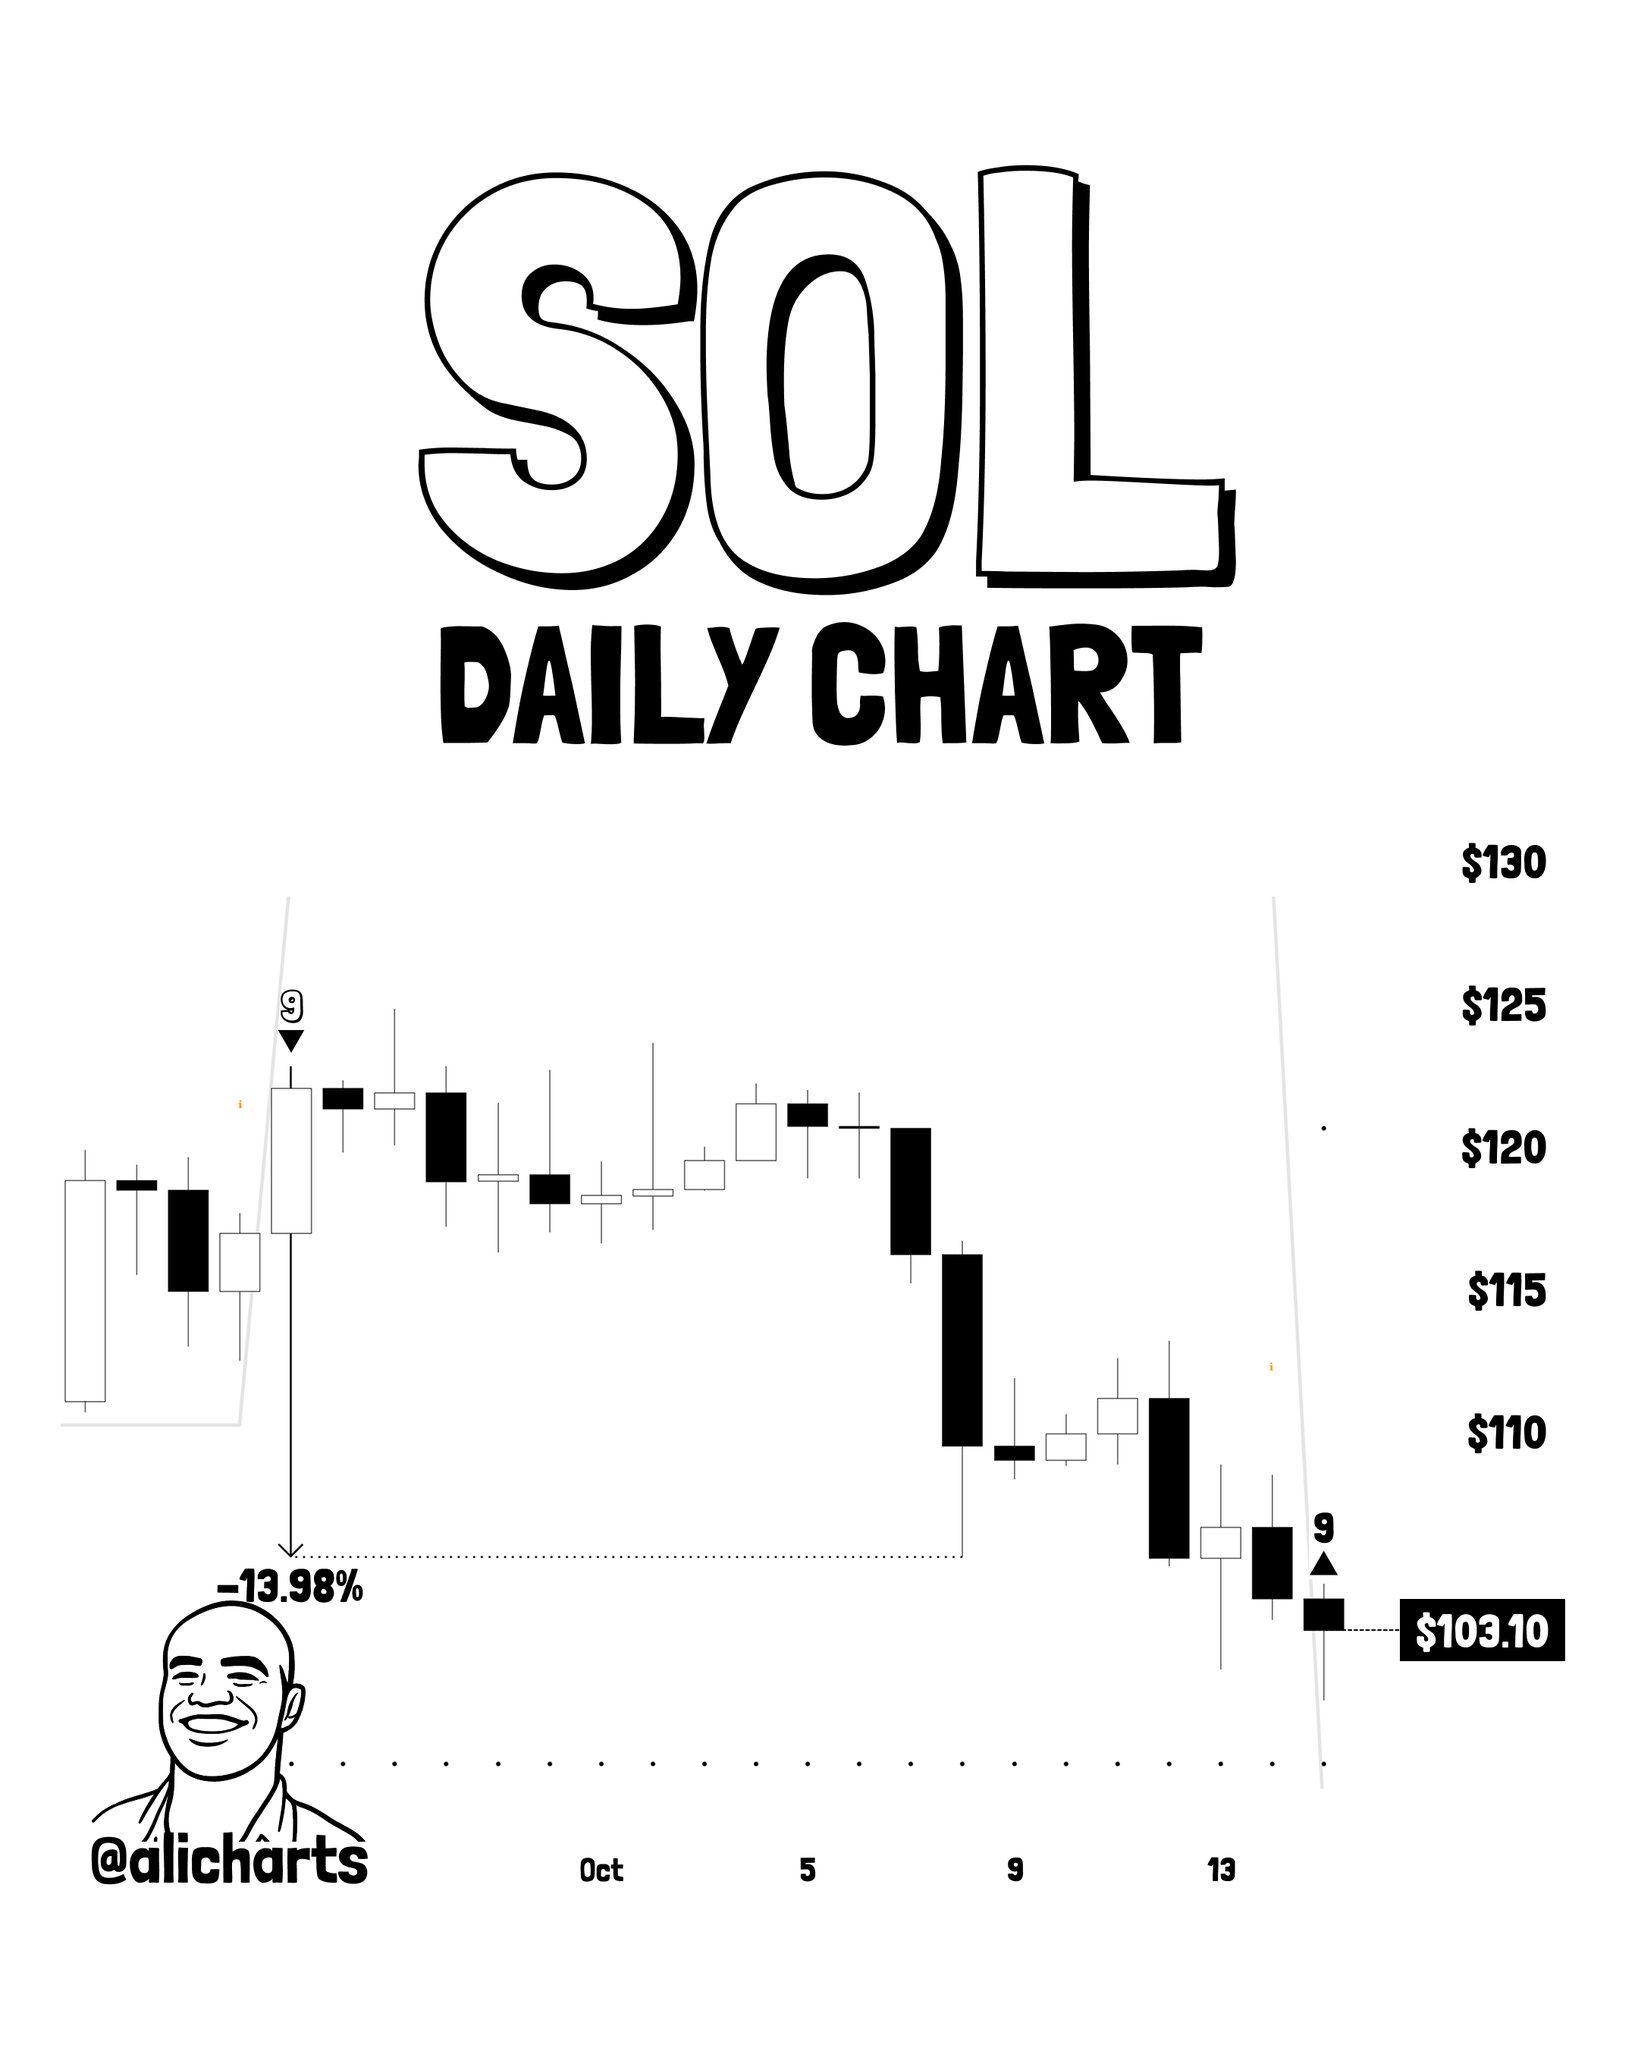
Martinez’s Solana chart presents a particularly credible setup because the same indicator’s prior reading already played out with precision. A TD Sequential sell “9” printed at a prior swing high in late September — and the decline that followed measured exactly -13.98%, printed directly on the chart between two past price points. That sell signal’s accuracy is now being used as the baseline for the current buy “9” reading, which has appeared near $103.10. Martinez’s stated targets are $111 as the first level and $120 as resistance. The symmetry between a confirmed sell signal and a fresh buy signal on the same indicator, same timeframe, and same asset is the core of this setup’s credibility — though confirmation requires buyers to defend current levels.
Source: @alicharts (X)
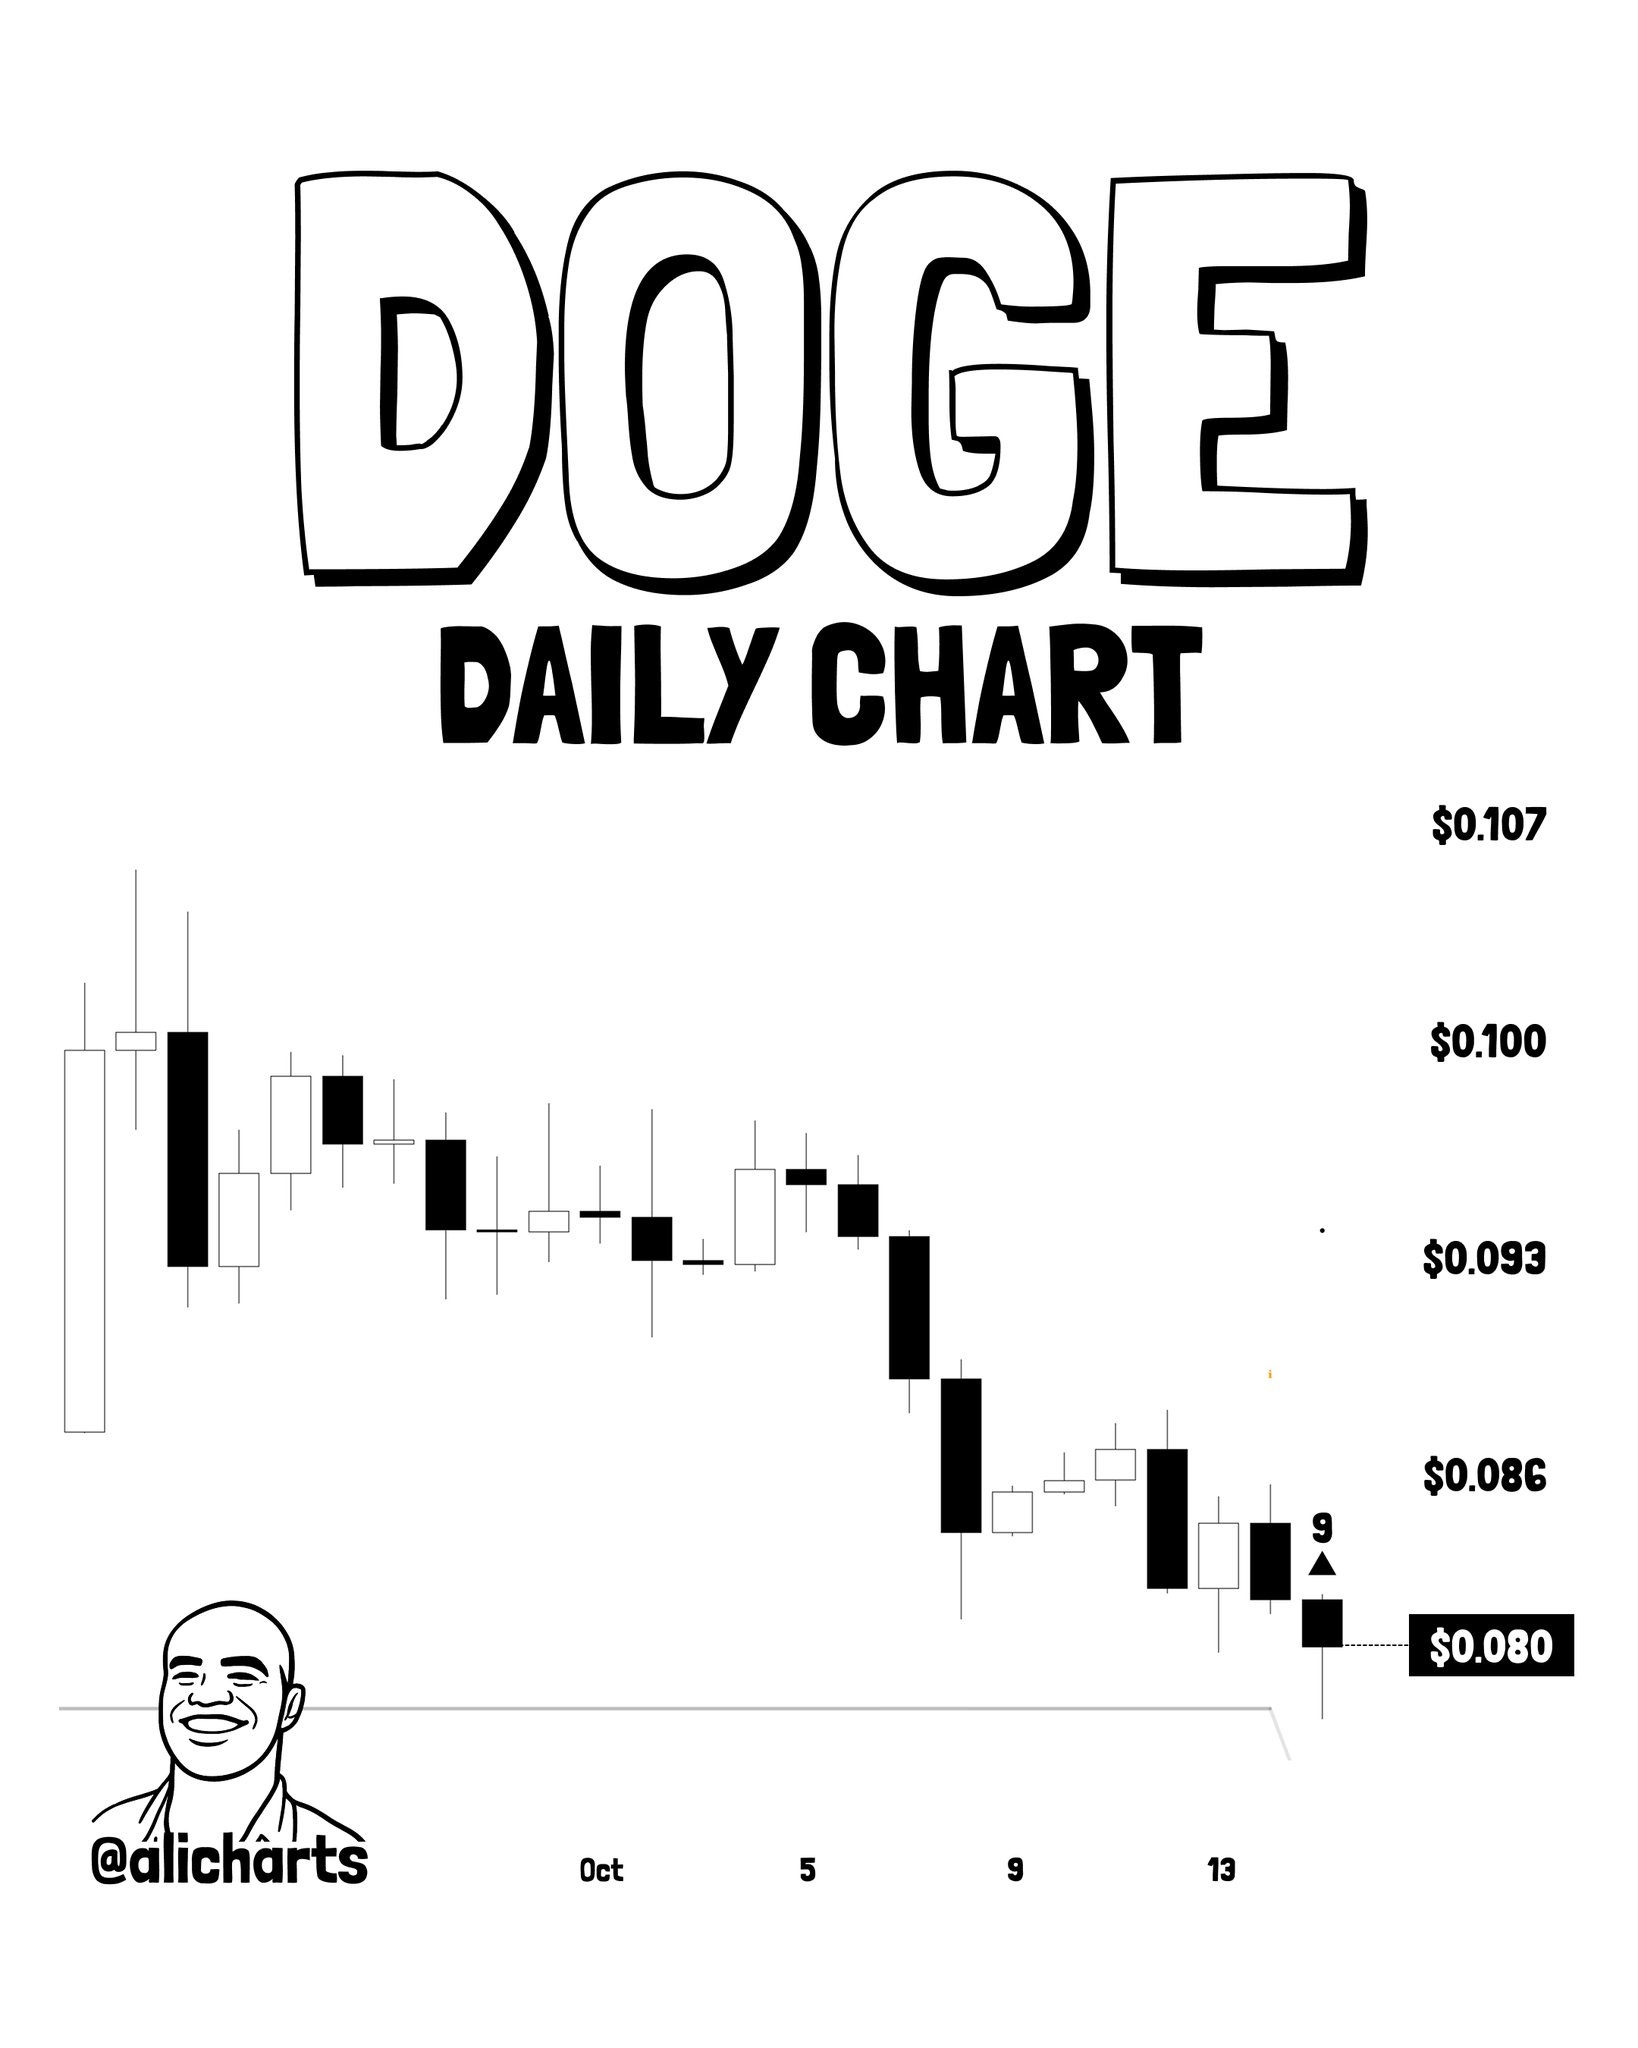
The Dogecoin daily chart shows a descending sequence of bearish candlesticks converging on a horizontal dashed support line at $0.080, where a TD Sequential “9” buy signal (upward triangle) has appeared. The confluence of a prior horizontal support level and a momentum exhaustion reading at the same price is what Martinez flags. First target: $0.087. Second target: trendline resistance at $0.094. No percentage was printed on the DOGE chart — the setup is purely price-level and indicator-based.
Source: @alicharts (X)
The Hyperliquid chart contains the most explicit historical precedent of the four. The first TD Sequential buy “9” signal, which printed around October 1, is annotated with a +10.65% move that followed — a completed, labeled outcome visible directly on the chart. A second buy “9” signal has now appeared near the current price of $80.16, with Martinez drawing a direct parallel to the prior setup. First target: $86. Resistance: $93. The prior signal’s documented +10.65% outcome gives this chart a concrete track record rather than a purely theoretical precedent.
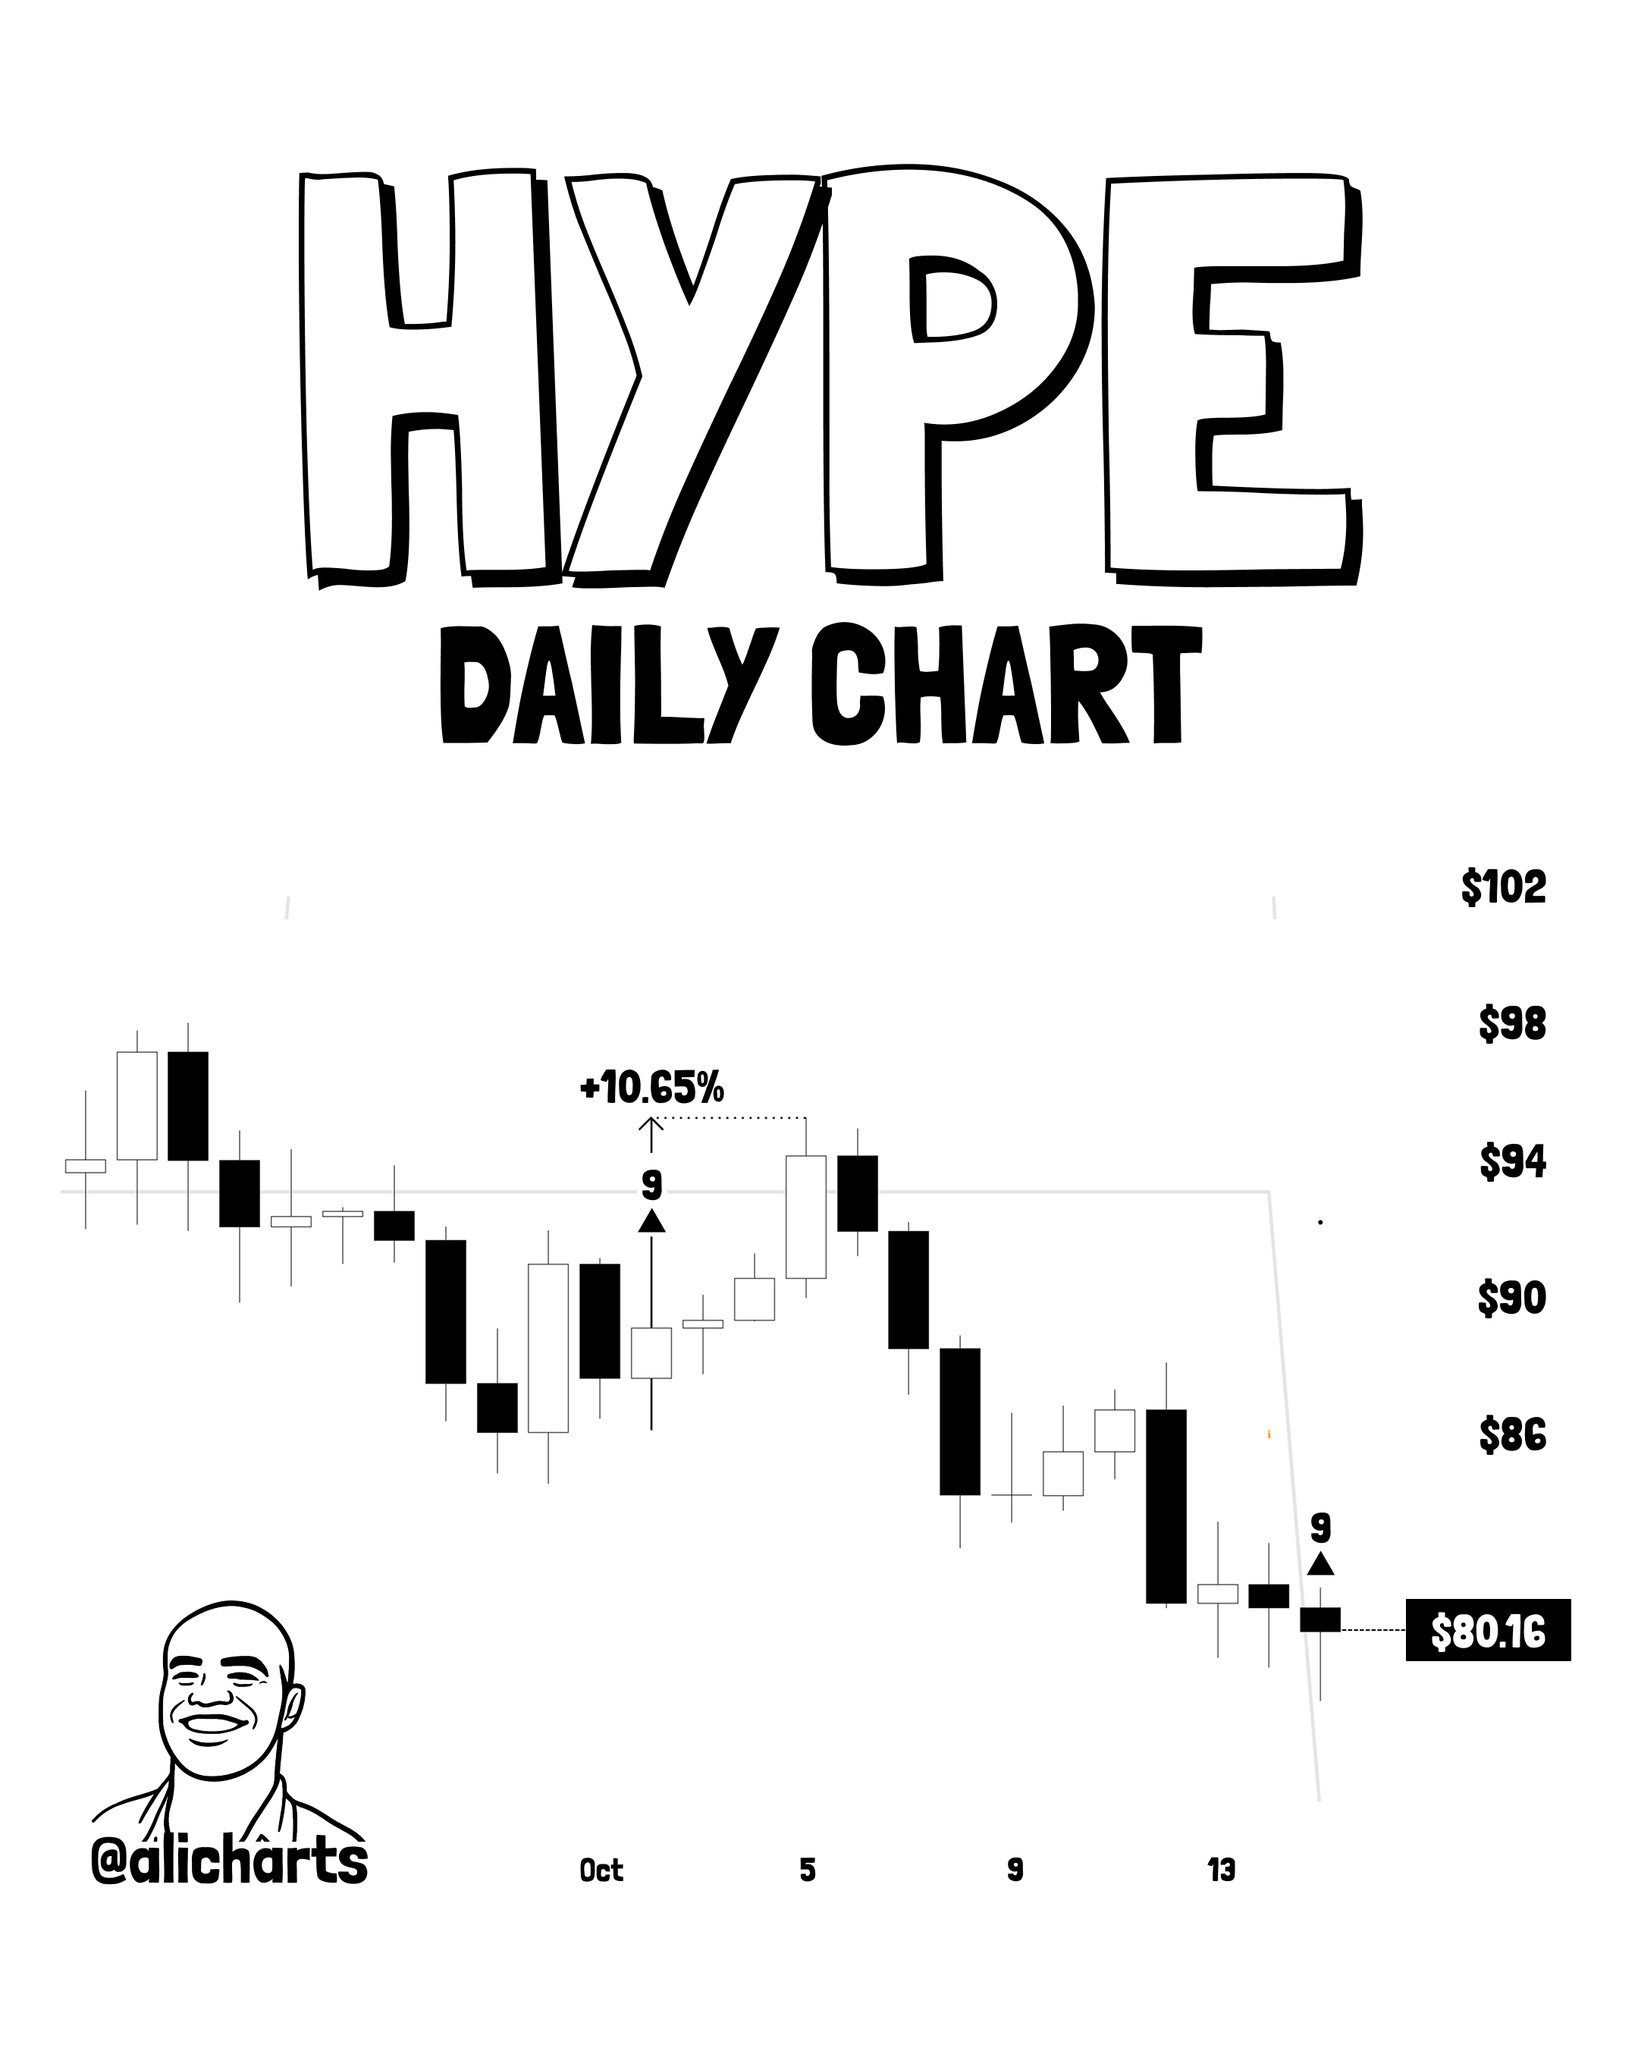
Source: @alicharts (X)
Four independent assets on four independent daily charts printing TD Sequential exhaustion signals within the same short window (late October 13 to October 15) does not happen by coincidence of indicator mechanics alone — it reflects the same macro selling cycle reaching exhaustion across the altcoin complex simultaneously. This is not a cross-asset correlation argument; it is a calendar argument: when a broad crypto drawdown occurs in a compressed timeframe, the same countdown-based indicator will mathematically reach completion across multiple assets at approximately the same time. The significance is not that these assets are correlated — it is that a single market event (the October drawdown) has driven sequential exhaustion in all four simultaneously, creating a synchronized potential reversal window.
Asset
Signal Type
Chart Price Level
First Target
Resistance Level
XRP
S13 + TD9 + A13
$1.317
$1.40
$1.50
SOL
TD9 Buy
$103.10
$111
$120
DOGE
TD9 Buy
$0.080
$0.087
$0.094
HYPE
TD9 Buy (2nd)
$80.16
$86
$93
TD Sequential Buy Signal Summary — Oct 15, 2026 | Source: @alicharts (X)
Bullish Scenario
XRP defends current levels and clears $1.40 on a daily close — opening the path to the resistance trendline at $1.50. On Solana, a close above $111 would confirm the buy signal’s follow-through, mirroring the prior sell signal’s -13.98% precision. Hyperliquid’s prior TD9 delivered +10.65% — a comparable move from $80.16 targets approximately $88.70.
Bearish Scenario
XRP fails to hold $1.317 with daily closes below that level invalidating the exhaustion thesis and reopening the descending channel toward $1.20. On DOGE, a break below the $0.080 support confluence dissolves both the horizontal support and the TD Sequential buy premise simultaneously.
The TD Sequential has flagged simultaneous buy-signal exhaustion across XRP, Solana, Dogecoin, and Hyperliquid — a confluence that reflects the October drawdown reaching mathematical completion across the altcoin complex at the same time. Martinez’s thesis is conditional: buyer defense of current levels is required for any of the stated targets to become relevant. On XRP, that means holding near $1.317 and clearing $1.40. On Solana, it means the buy “9” producing the same precision its sell counterpart delivered at -13.98%. On Hyperliquid, a prior identical setup already printed +10.65% — whether the second signal repeats that outcome is the live question. Watch $1.40 on XRP as the first confirmation that buyers have answered the exhaustion signal.
Disclaimer: The views and analysis presented in this article are for informational purposes only and reflect the author’s perspective, not financial advice. Technical patterns and indicators discussed are subject to market volatility and may or may not yield anticipated results. Investors are advised to exercise caution, conduct independent research, and make decisions aligned with their individual risk tolerance.Also Read: XRP Whale Inflows to Binance Hit Seven-Month High — Sell Pressure Risk Rises