TLDR XRP is trading at $1.08, down 1% on the day and about 21% below its 200-day moving average of $1.37. Price action has compressed into a tight range, with technical indicators like MACD a
TLDR
- XRP is trading at $1.08, down 1% on the day and about 21% below its 200-day moving average of $1.37.
- Price action has compressed into a tight range, with technical indicators like MACD and RSI sending mixed signals.
- Open interest jumped over 10% in 24 hours, and both institutional and retail traders are heavily positioned long.
- Analysts have set year-end targets between $3.00 and $4.00, based on regulatory and institutional developments.
- Historical charts show XRP has only had five major bull rallies in 12 years, each followed by steep pullbacks.
XRP is currently trading at $1.08. That’s a small drop of about 1% over the last day. The token sits roughly 21% below its 200-day moving average of $1.37.
Price movement has slowed to a crawl. The 24-hour trading range was just $0.03, and the Average True Range sits at the same low figure. Bollinger Bands are tightening, a pattern that often comes before a sharp move in either direction.
Short-term moving averages are stacked above the current price. The 7, 20, and 50-day averages all sit higher, forming a wall of resistance overhead.
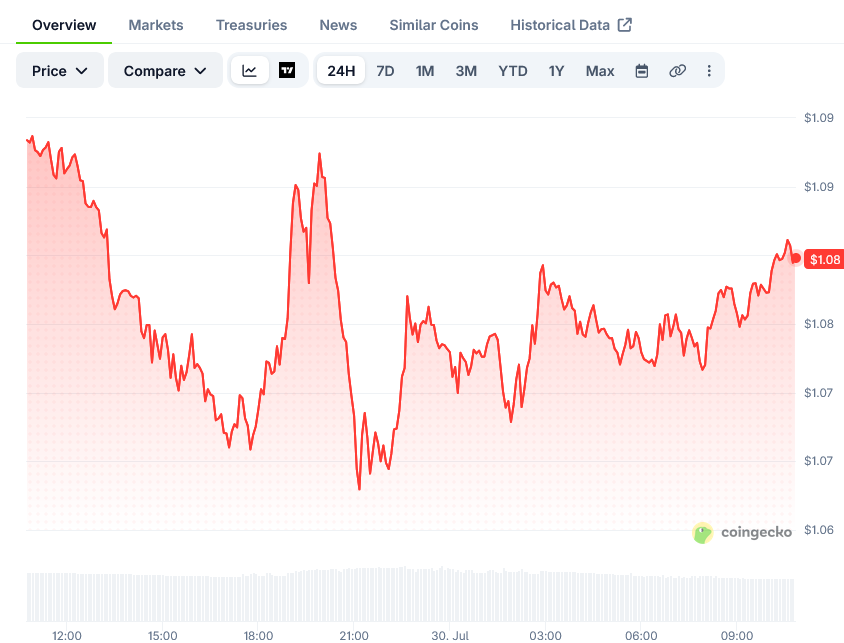 XRP Price on CoinGecko
Technical Indicators Point in Different Directions
MACD has flattened out with a histogram reading of zero. This means the downtrend has lost momentum, but buyers haven’t stepped in with enough force to reverse it.
RSI is at 44. That’s not low enough to trigger buying interest, and not high enough to draw in momentum traders either.
Stochastics tell a different story. With %K at 26.67 and %D at 21.34, the oscillator is pushing into oversold territory. This has historically led to short bounces within a few trading sessions.
The Bollinger %B reading of 0.27 shows price is hugging the lower band. A drop from here would quickly test the $1.05 level, which traders are watching closely as a floor.
Whale and Trader Positioning
Open interest rose 10.46% in the past 24 hours. That points to new money entering the market rather than existing positions shifting around.
Institutional traders are 75.6% long, and retail traders are close behind at 72.6% long. Despite this, the taker buy/sell ratio sits at 0.77, meaning sellers are currently winning more trades than buyers.
Some analysts have longer-term price targets. Motley Fool’s Dominic Basulto has set a target of $4.00 by the end of 2026. Fellow contributor Alex Carchidi has pointed to $3.00 as a floor target for the token this year.
These targets are tied to ongoing regulatory clarity and expanded use cases for XRP, not short-term chart patterns.
Looking at the bigger picture, XRP has only seen five major bull rallies in its 12-year history, according to lifetime TradingView charts. Each time, the token gave back most of its gains afterward.
The pattern has repeated at different price levels. When XRP climbed above $1.50, it later fell below $0.50. When it passed $2, it dropped to $0.90. After rising above $3 on three separate occasions, it fell back to $1.10 each time.
XRP hit an all-time high of $3.65 in July of last year. It is now down about 70% from that high, having touched a low of $1.07.
The token is currently at risk of dropping below the $1 mark, with some analysts pointing to $0.90 as the next level down if that happens. Bitcoin has been trading in the $60,000 to $65,000 range for months, and the broader crypto market has not seen a strong upward move this year.
The post XRP (XRP) Price: Key $1.05 Support Level Under Watch This Week appeared first on Blockonomi.