Key Takeaways Mid-November support near $800 gave way. Bounce stalled at the 0.5 level near $975. 50-day average falling fast toward the 100-day. RSI just under 30, no capitulation volume. Fr
Key Takeaways
- Mid-November support near $800 gave way.
- Bounce stalled at the 0.5 level near $975.
- 50-day average falling fast toward the 100-day.
- RSI just under 30, no capitulation volume.
Friday’s drop came as part of a broader selloff across the crypto market.
A 15% Candle Through the $800-$810 Zone
ZEC opened Friday near $894, reached $899 and then fell as low as $746. As of 19:36 UTC, with more than four hours left in the session, it traded near $763, down 14.67%. That puts price under two levels that sit almost on top of each other: the 200-day simple moving average at $810 and the 0.618 retracement near $800.
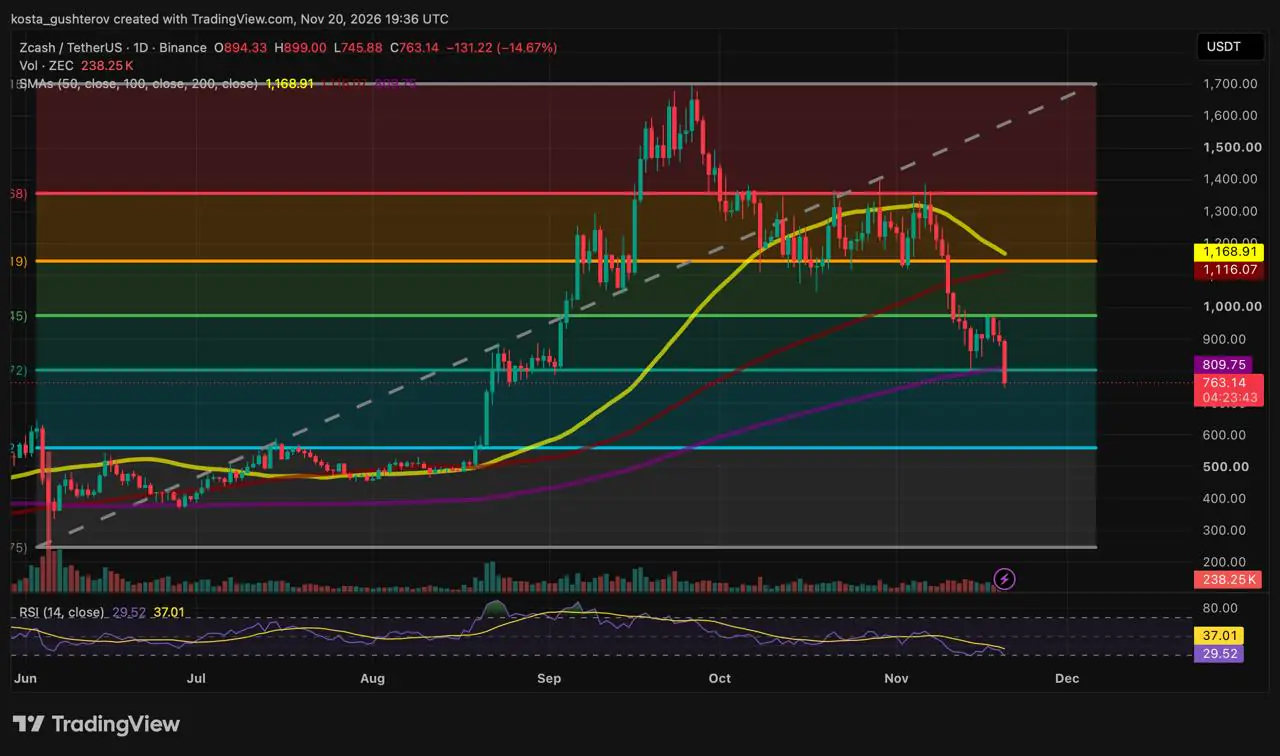
Chart: ZEC/USDT daily, Binance,
via TradingView, captured November 20, 2026, at 19:36 UTC with the daily candle still open. Fibonacci levels are approximate where the chart’s labels are cut off.
The zone had already been tested once. ZEC’s first leg down in mid-November stopped just above it, and buyers pushed price back up from there. When ZEC traded near $921 earlier this week, Coindoo’s weekly chart analysis named the 200-day as the nearest daily support if the weekly channel floor gave way. On Friday the candle went straight through it, taking ZEC to prices it last traded at in late August.
How the Decline Built
From the peak to Friday, one step down at a time
Late September
Peak near $1,700
Early October
Rising trendline from the June low gives way
Oct – early Nov
Range capped around the 0.236 level near $1,355, with wicks above it but closes below
Mid-November
Range floor breaks; first slide stops just above $800-$810
Earlier this week
Bounce stalls at the 0.5 level near $975
November 20
Candle cuts through $800–$810
Each support has also held for less time than the one before. The October range kept ZEC up for about five weeks. The mid-November low lasted about one.
Little Trading History Below $746
Friday’s low near $746 marks the bottom of the area where ZEC paused after its August breakout. Below it, the climb from about $550 to $800 happened so fast that the chart has almost no closes in between. That’s why the next labeled support sits as far down as the 0.786 retracement near $560.
Trading history between $450 and $900
▼ -$763
$450
$900
■ $450–$500: core of the summer base, about two months of trading
■ $500–$580: upper summer range, with its ceiling near $560 tested in July
■ $580–$746: crossed in a few late-August candles
■ $746–$900: about two weeks of trading in late August and early September
Averages Overhead, Momentum Just Turning Oversold
ZEC has now lost all three daily averages, one at a time: the 50-day in October, the 100-day in the mid-November break and the 200-day, at $810, on Friday. Higher up, the 50-day at $1,169 is falling fast toward the 100-day at $1,116, which is still rising but flattening. The 0.382 retracement near $1,145 sits between the two, which makes $1,116-$1,169 the densest resistance band on the chart. The 50-day is still above the 100-day, but the gap between them has narrowed sharply since early November.
The 14-day RSI reads 29.52, just under the 30 line that marks oversold territory and well below its own average at 37.01. It has only just crossed that threshold: a fresh oversold reading, not a deep one.
Volume reads 238.25K ZEC with more than four hours left in the session, small next to the spikes that marked the June low and the late-August breakout. Nothing on the chart yet resembles the volume of a washout.
What the Daily Close Sets Up
BREAKDOWN HOLDS
Below $800
If: ZEC closes below $800 and retests into the $800-$825 zone fail
Then: the broken 200-day becomes resistance, and the $560–$580 area, just above the 0.786 level, is the next reference
WASHOUT AND BASE
Near $560
If: price reaches the area near $560 or sweeps into $500-$540, with a volume spike and RSI steadying in the low 20s
Then: the chart would show the exhaustion this week’s selling has lacked, at the strongest support below $746. If $560 gives way, the $450–$500 base is the next reference
FAILED BREAKDOWN
Above $860
If: ZEC closes back above $825-$850, reclaiming both the 200-day and the 0.618 level, and then clears $860
Then: Friday’s drop becomes a failed breakdown, and the 0.5 level near $975 comes back into range
That leaves ZEC with resistance about 6% above, at the 200-day average, and the next labeled support about 27% below, near $560.
This article is for informational purposes only and is not financial, investment or trading advice. The levels and scenarios describe chart conditions, not price predictions. Cryptocurrencies are highly volatile; do your own research before making any decision.
The post Zcash Price Crashes Through $800 With Little Support Below appeared first on Coindoo.