The Zcash price today is trading at 1,218, down 0.45%. A trader on X says ZEC ran from the $400s to $1,700, and anyone who missed that move is watching this pullback closely. The trader now c
The Zcash price today is trading at 1,218, down 0.45%. A trader on X says ZEC ran from the $400s to $1,700, and anyone who missed that move is watching this pullback closely.
The trader now calls the current area a make-or-break zone. This Zcash price prediction covers that call, the liquidation data, and the levels on the chart.
Market data checked on October 10, 2026
Zcash Price Prediction Today: Market Overview
Metric
Value
Price
$1,218.36
24 hr Change
-0.45%
Zcash Latest Update: Developers Target January 2027 for Quantum-Resistant Payments
A post by Gemini on X says Zcash developers are aiming for January 2027 to roll out quantum-resistant payments. "Quantum-resistant" means built to stay secure against future quantum computers, which could break some of today’s encryption.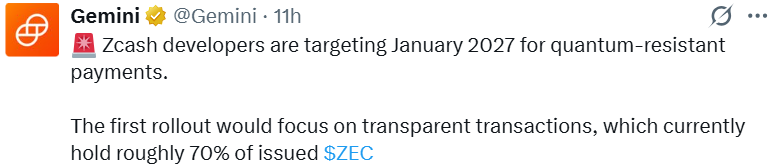
The post says the first rollout would cover transparent transactions, which are visible on the public chain and hold roughly 70% of issued ZEC.
Zcash News Today: Trader Calls $1,050 to $1,100 a Make or Break Zone
A post on X says ZEC has pulled back to a key support zone between $1,050 and $1,100. Support is a price area where buyers have stepped in before. The trader says that if buyers defend it, another leg up could follow, and if it breaks, the bears get their moment.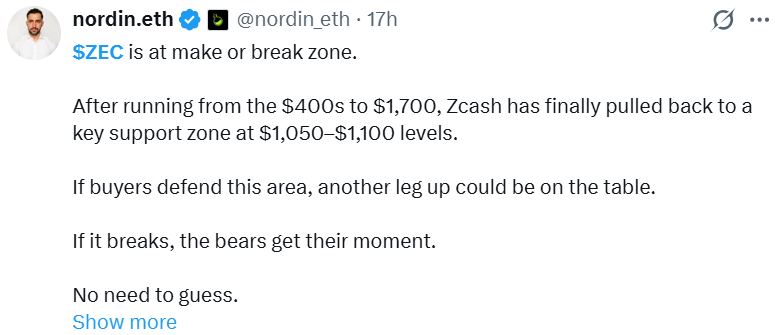
Source: Data From X
This is one trader's view. CoinGabbar could not independently verify how the setup will play out.
Crypto News Today: ZEC Liquidation Data Shows Shorts Taking the Hit
A liquidation happens when an exchange force-closes a leveraged trade because the trader can no longer cover the loss. A long is a bet that the price will rise. A short is a bet that the price will fall.
Window
Total Liquidated
Long
Short
1h
$9.66K
$1.22
$9.66K
4h
$228.96K
$57.40K
$171.56K
12h
$967.55K
$536.36K
$431.19K
24h
$4.18M
$1.50M
$2.69M
Source: Coinglass futures data. Totals may differ slightly from the sum of long and short because the source rounds each figure.
Shorts made up about 64% of the 24-hour total and about 75% of the 4-hour total. The 12-hour window leaned the other way, with longs at about 55%.
Rising prices can force short sellers out of their trades, so the recent mix fits a bounce. The amounts are small, though, which limits what the data can say on its own.
Zcash Price Chart: Technical Analysis
ZEC rose through September and peaked near $1,700 in late September. It then fell back, traded for several days near $1,272.56, and dropped through that level in a sharp move on October 8. The low came close to $1,100.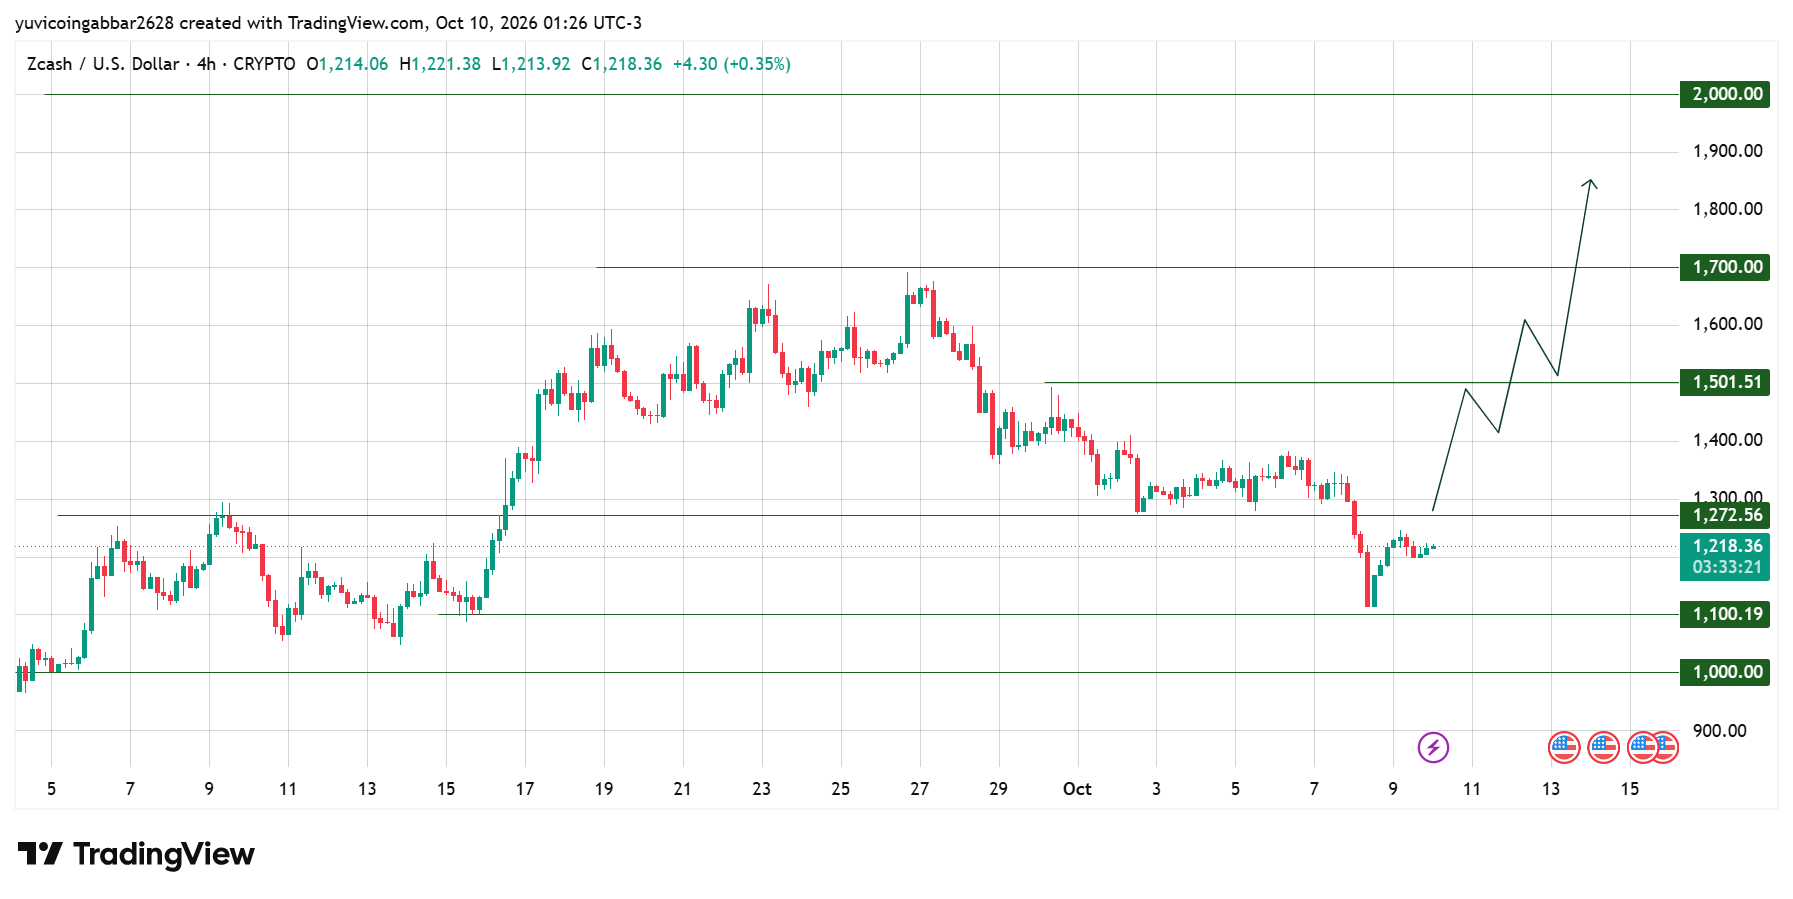
The latest 4H candle opened at $1,214.06, ranged between $1,213.92 and $1,221.38, and sits at $1,218.36. Price is now between $1,100.19 and $1,272.56, a gap of about $172.
The path drawn on the chart shows a move through $1,272.56, then $1,501.51 and $1,700.00, with $2,000.00 as the top marked level.
$ZEC Support Levels: Where the Pullback Could Hold
$1,100.19 is the first support. It sits at the upper edge of the zone the trader named, and it lines up with a low from mid-September. If it fails, $1,000.00 is the next marked level below.
$ZEC Resistance Levels: Targets in This ZEC Forecast
$1,272.56 is the nearest resistance, meaning an area where sellers have pushed prices down before. ZEC held near it for several days before losing it on October 8. Above that, the chart marks $1,501.51, then $1,700.00, then $2,000.00.
Zcash Forecast: Triggers and Invalidation
Scenario
Trigger
Likely Outcome
Invalidation
Bounce extends
Hold above $1,100.19 and close above $1,272.56
Move toward $1,501.51
Close below $1,100.19
Range builds
Trade between $1,100.19 and $1,272.56
Base forms before the next move
Close outside the range
Decline resumes
Close below $1,100.19
Slide toward $1,000.00
Reclaim $1,100.19
A close is the price where a candle finishes. Traders often use it instead of a brief wick, which is a thin spike that reverses quickly.
Zcash Price Prediction: Can ZEC Reach $2,000?
ZEC would need to pass $1,272.56, $1,501.51, and $1,700.00 first. A move to $2,000.00 from $1,218.36 is a gain of about 64%, while a return to $1,700.00 is about 40%. The chart does not show that move yet, since the price is still below $1,272.56.
Zcash Price Prediction 2026: Expert View
According to CoinGabbar analysts, the make-or-break label fits the chart, as the price sits between two clear levels with no confirmed direction.
The next few 4H candles near $1,272.56 and $1,100.19 will show which side has control. Until one of them breaks, ZEC is likely to keep moving inside this range.
Disclaimer
This article is for informational purposes only and is not financial advice. Crypto markets are volatile. Do your own research before making any trading decisions involving ZEC.