One analyst wants to see ZEC build a base over the next few weeks before a big move in early 2027. Is that setup forming? Partly. Price has moved sideways for weeks, but it now sits under two
One analyst wants to see ZEC build a base over the next few weeks before a big move in early 2027. Is that setup forming? Partly. Price has moved sideways for weeks, but it now sits under two key trend lines after a 1.84% drop.
This Zcash price prediction checks the call against the liquidation data and the daily chart, then lists the levels that matter next.
Market data checked on October 26, 2026, at 09:36 IST.
Zcash Price Prediction Today: Market Overview
Metric
Value
Price (TradingView daily chart)
$1,185.20
Daily Candle Change
-1.84%
Candle Open
$1,212.15
Candle Range
$1,176.92 – $1,217.52
Why is ZEC’s price down today?
The Zcash price today is down 1.84% to $1,185.20 in 24 hours, closely tracking a broader market decline, primarily driven by macro-driven risk aversion. It slightly underperformed Bitcoin's 1.48% drop, with liquidations and technical resistance adding pressure.
Primary reason: Broader market sell-off, as ZEC moved in lockstep with Bitcoin amid rising inflation fears and risk-asset weakness.
Secondary reasons: Futures liquidations totalling $14.02 million (mostly longs) and a rejection from the key 1,224 –1,312 resistance zone.
Zcash News Today: CoinGecko Flags ZEC to Watch
CoinGecko's X account posted that all eyes are on HYPE, ZEC and SOL, and asked if readers are watching them.
The post gives no reason or data. Attention can lift trading activity, but it does not set direction.
ZEC News: A Base Before Q1 2027
Altcoin Sherpa posted about 13 hours before publication that he would like to see ZEC form a base over the next few weeks and get ready for a "giga move" in Q1 2027. A base is a sideways stretch where price stops falling and builds support.
Source: Data From X
This is one analyst's opinion, not a confirmed call.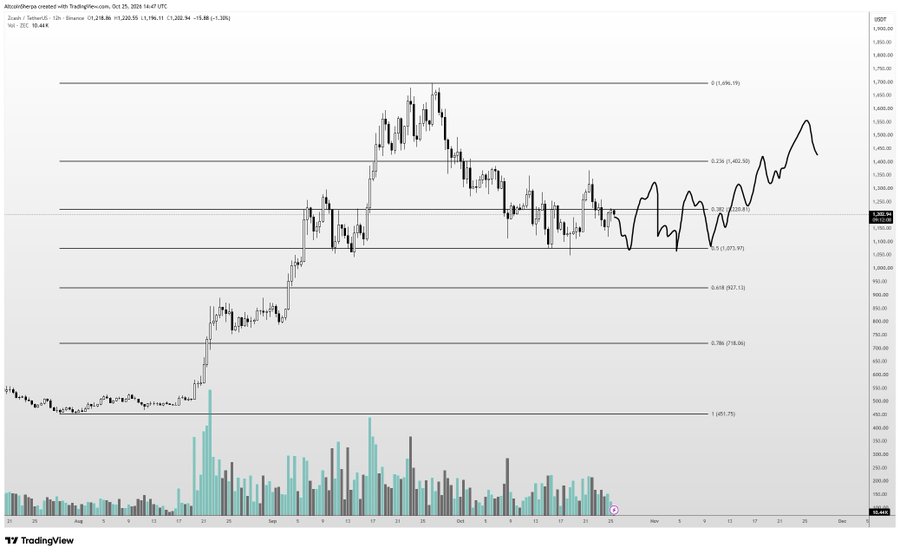
Zcash Outlook: $ZEC Liquidation and Futures Volume
A liquidation happens when an exchange force-closes a leveraged trade because the trader can no longer cover losses. Longs bet on a rise, and shorts bet on a fall.
Window
Total Liquidated
Long
Short
12h
$3.17M
$1.81M
$1.36M
24h
$5.12M
$2.84M
$2.29M
Source: Data From CoinGlass
Longs took about 55% of the $5.12M liquidated over 24 hours and about 57% of the 12-hour total. Both sides were hit, which fits a market moving sideways.
Coinglass futures volume leads with Binance at $1.52B, MEXC at $1.37B, OKX at $921.22M and LBank at $291.86M. The screenshot gives no time window.
Zcash Price Prediction: $ZEC Trades in a Range Near Its EMAs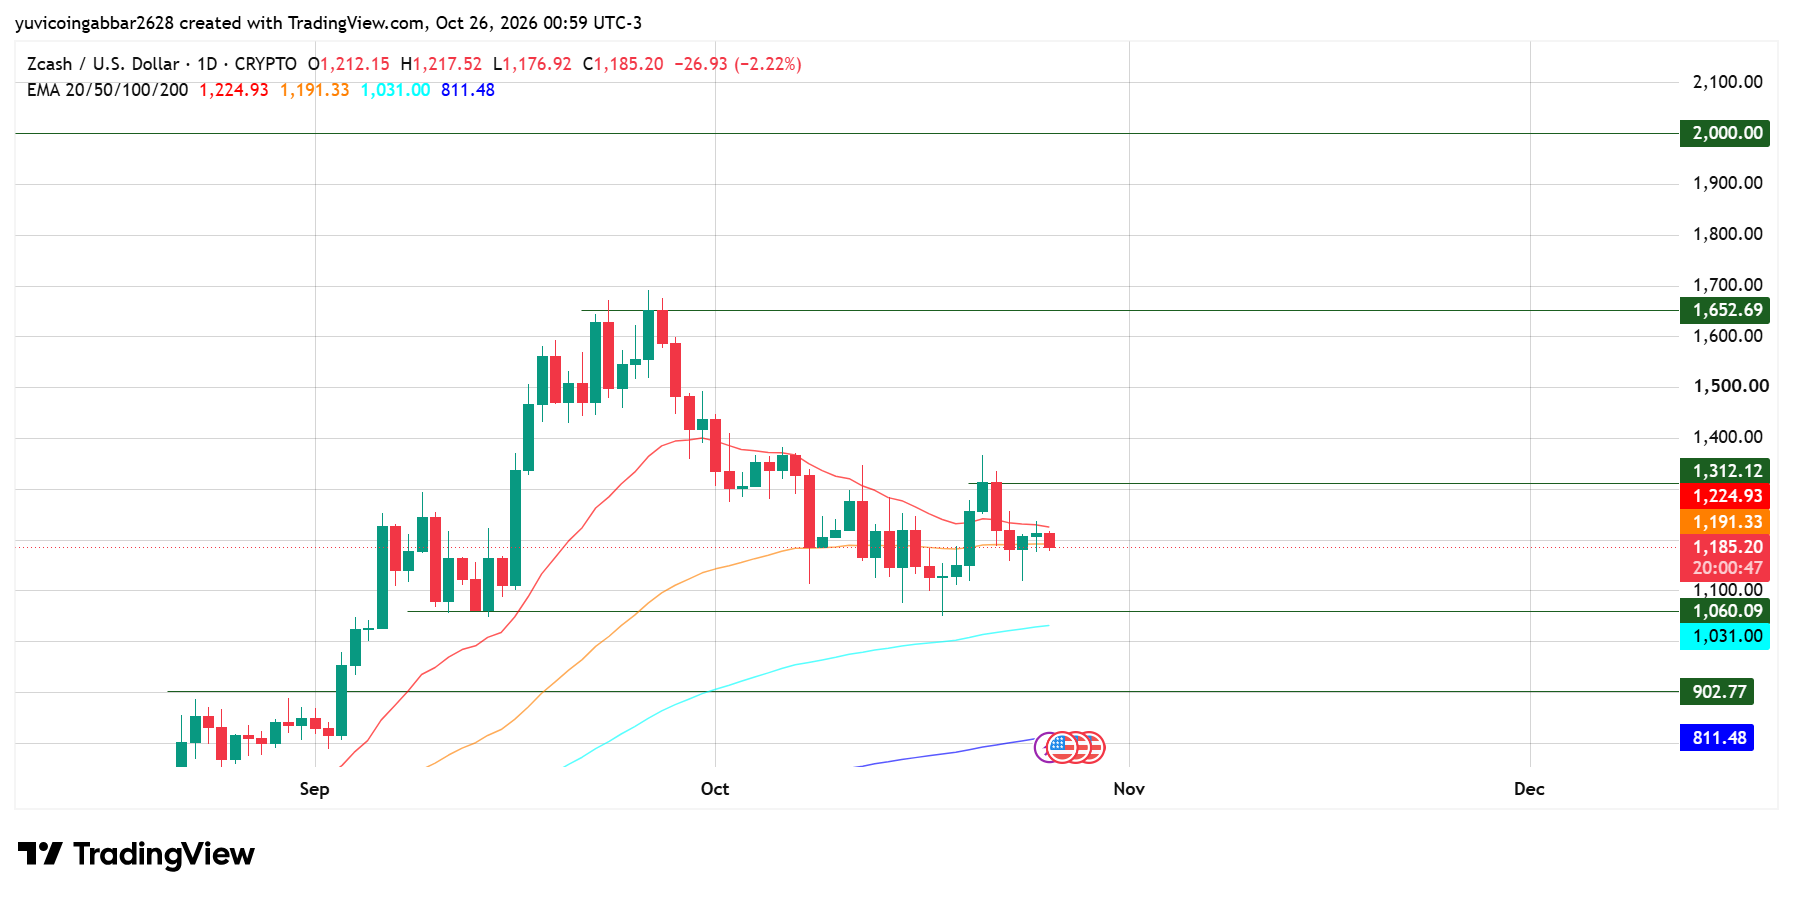
$ZEC has moved between $1,060.09 and $1,312.12 since early October, after peaking near $1,652.69 in late September.
Today's candle opened at $1,212.15, ranged from $1,176.92 to $1,217.52 and closed the reading at $1,185.20.
An EMA is a trend line that weights recent prices more heavily. Price sits just under the 50 EMA and below the 20 EMA, but above the 100 and 200 EMAs.
That mix fits a sideways market, where short-term lines cap price and longer lines hold the broader trend.
The 1060 level is the key support to watch. As long as the price holds above this zone, the bullish market structure remains intact, with buyers continuing to defend higher lows and keep momentum in their favor.
A sustained daily close below 1060 would signal weakening demand and invalidate the current uptrend, opening the door to a deeper pullback toward the next support zone.
EMA
Value
Position vs Price
EMA 20 (red)
$1,224.93
Above price
EMA 50 (orange)
$1,191.33
Above price
EMA 100 (cyan)
$1,031.00
Below price
EMA 200 (blue)
$811.48
Below price
Zcash Forecast: Support and Resistance Levels
Type
Level
Highest marked level
$2,000.00
Higher resistance
$1,652.69
Nearest resistance
$1,312.12
Immediate support
$1,060.09
Deeper support
$902.77
Bull case: A daily close above the EMA 20 at $1,224.93 would put $1,312.12 back in play, and a close over that would open $1,652.69.
Bear case: If $ZEC closes below $1,060.09, the range would break lower, and price could slide toward the EMA 100 at $1,031.00, then $902.77.
ZEC Scenarios and Invalidation (October 26, 2026)
Scenario
Trigger
Likely Outcome
Invalidation
Bull
Close above $1,312.12
Move toward $1,652.69
Close below $1,060.09
Base
Range of $1,060.09 to $1,312.12
Sideways base forms
Break of either level
Bear
Close below $1,060.09
Slide toward $902.77
Close back above $1,060.09
Zcash Price Prediction: Can Zcash Reach $2,000?
It would take a gain of about 69% from $1,185.20. Any ZEC price prediction toward that level needs more than a forecast for early 2027, since $ZEC must clear the EMA 20, $1,312.12 and $1,652.69 first.
Zcash Price Prediction 2026: Expert View
Momentum is flat, with price tangled between the 20 and 50 EMA, so the first move out of this range will set the tone.
Disclaimer
This article is for informational purposes only and isn't financial advice. Crypto markets are volatile. Always do your own research before making any trading decisions involving ZEC.