Zcash co-founder Eli Ben-Sasson sees ZEC reaching $5K by the end of 2026. ZEC is currently trading around $1.4K, down more than 9%. Zcash co-founder Eli Ben-Sasson is putting numbers on the t
- Zcash co-founder Eli Ben-Sasson sees ZEC reaching $5K by the end of 2026.
- ZEC is currently trading around $1.4K, down more than 9%.
Zcash co-founder Eli Ben-Sasson is putting numbers on the table. A few days back, he called ZEC above $1,200 by September 25, and it hit. Now he has set his end-of-year target at $5,000.
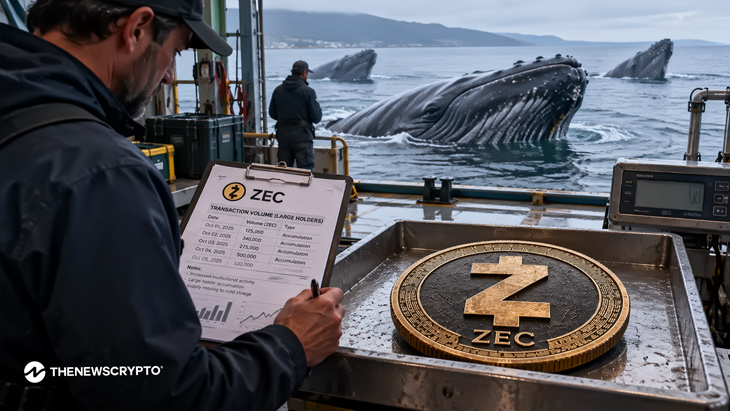
His reasoning is that ZEC is like a second type of Bitcoin, and a large portion of crypto holders have not caught up with that yet. Whale accumulation has picked up significantly, and he’s already fielding questions from large players asking why the price is moving.
The recent volatility is organic; there is a visible gap between accumulation activity and broader market sentiment, which tends to close fast when attention catches up. Significantly, getting from $1,488 to $5,000 is a 236% move.
Looking at Zcash Price Action
Zcash (ZEC) is currently trading within the $1,488 range, down by over 9%. Moreover, its volume is settled at $1.54 billion, with the 24-hour range sitting between $1,461 and $1,643. The seven-day range stretches from $1,342 to $1,658.
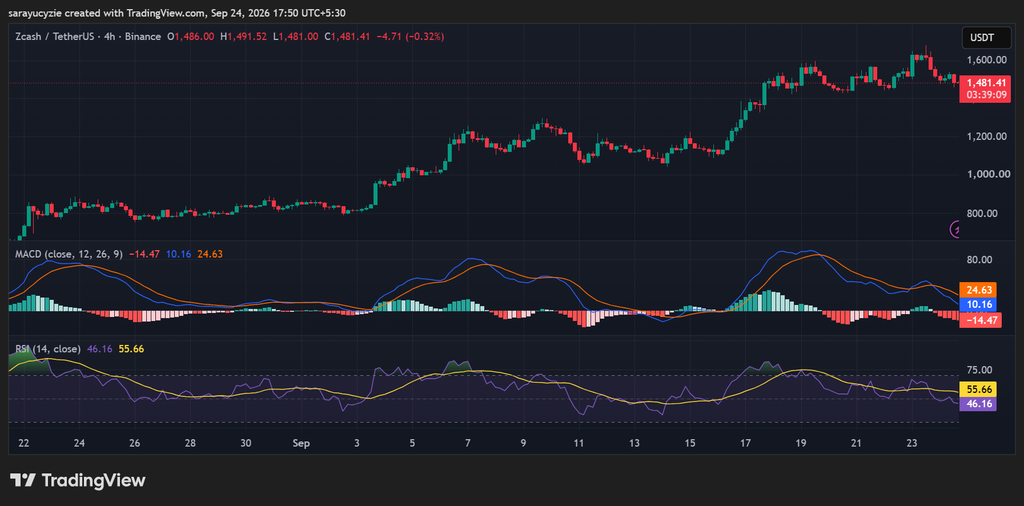
The four-hour price chart of the ZEC/USDT trading pair shows bearish pressure is in charge. The price could retrace toward its key support level at $1,432. A continued correction on the downside would trigger the death cross to take place and the price move even lower, toward the $1.3K zone.
On the flip side, if a bullish reversal occurs within the Zcash market, the price might immediately rise and find the nearest resistance range at around $1,530. Extended upside pressure could likely initiate the emergence of the golden cross and eventually send the asset’s price above $1.6K.
What is ZEC’s Technicals Hinting At?
The MACD line crosses below the signal line while both remain above the zero line. This indicates an uptrend is experiencing a loss of momentum. The overall broader structure remains in bullish territory. The crossover to the downside signals that short-term buying power is decelerating.
Sellers or profit-takers are temporarily controlling the short-term ZEC price, causing the momentum histogram to flip negative. Traders holding long positions tighten stop-losses or lock in partial profits. The MACD line should cross above the signal line to continue the broader uptrend.
 (Source: TradingView)
The current sentiment of Zcash is in neutral territory with a slight bearish bias, as the daily RSI is at 46.16. This suggests that neither buyers nor sellers are currently in strong control, reflecting a market in consolidation, experiencing a temporary loss of upward momentum.
Sitting under 50 signals that average losses over the measured period slightly outweigh average gains. The asset is leaving significant room for momentum to expand in either direction. Confirmation of the next direction requires a cross back above 50 or a breakdown toward 30.
Crypto Market Highlights
Bitcoin Whales Keep Accumulating as Price Slips: 100–1,000 BTC Wallets Add 113,950 BTC