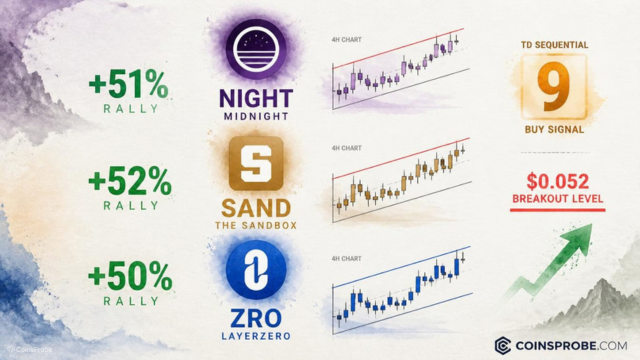
Key Highlights NIGHT surged 51% in one week ($0.032 → $0.049) — a four-hour close above $0.052 is the breakout trigger per @alicharts SAND gained 52% ($0.043 → $0.065) and now prints a TD Seq
Key Highlights
NIGHT surged 51% in one week ($0.032 → $0.049) — a four-hour close above $0.052 is the breakout trigger per @alicharts
SAND gained 52% ($0.043 → $0.065) and now prints a TD Sequential buy "9" near the low — mirroring the sell "9" that called the October 3 top
ZRO is pressing against the upper boundary of a rising parallel channel at $2.23 — rejection targets $2.10–$2.00; breakout above $2.30–$2.40 opens continuation
Three altcoins — Midnight ($NIGHT), The Sandbox ($SAND), and LayerZero ($ZRO) — each posted gains exceeding 50% in the seven days ending October 7, 2026. The moves are not random. Each asset is now at a technically defined decision point, with specific chart structures and indicator signals determining whether the rallies extend or reverse.
Crypto analyst Ali Martinez (@alicharts) flagged all three in a five-part thread, identifying the precise levels and signals traders should watch. What follows is a mechanism-first breakdown of each setup — price levels, signals, and the conditions that confirm or invalidate each thesis.
Midnight is the strongest performer of the three. According to Martinez, $NIGHT rose approximately 51% over the past week, climbing from roughly $0.032 to $0.049. The token reached a high near $0.053 on October 3 before pulling back into a horizontal consolidation channel. At the time of writing, $NIGHT is trading at approximately $0.0492.
The 4-hour chart, as flagged by @alicharts, shows price oscillating between two clearly defined horizontal boundaries. The upper boundary — resistance — sits near $0.052. $NIGHT has tested that level twice without a sustained close above it. The shaded consolidation zone between the channel boundaries is the focal area of the setup. The lower boundary of the channel sits near $0.045, with a secondary support level visible near $0.040.
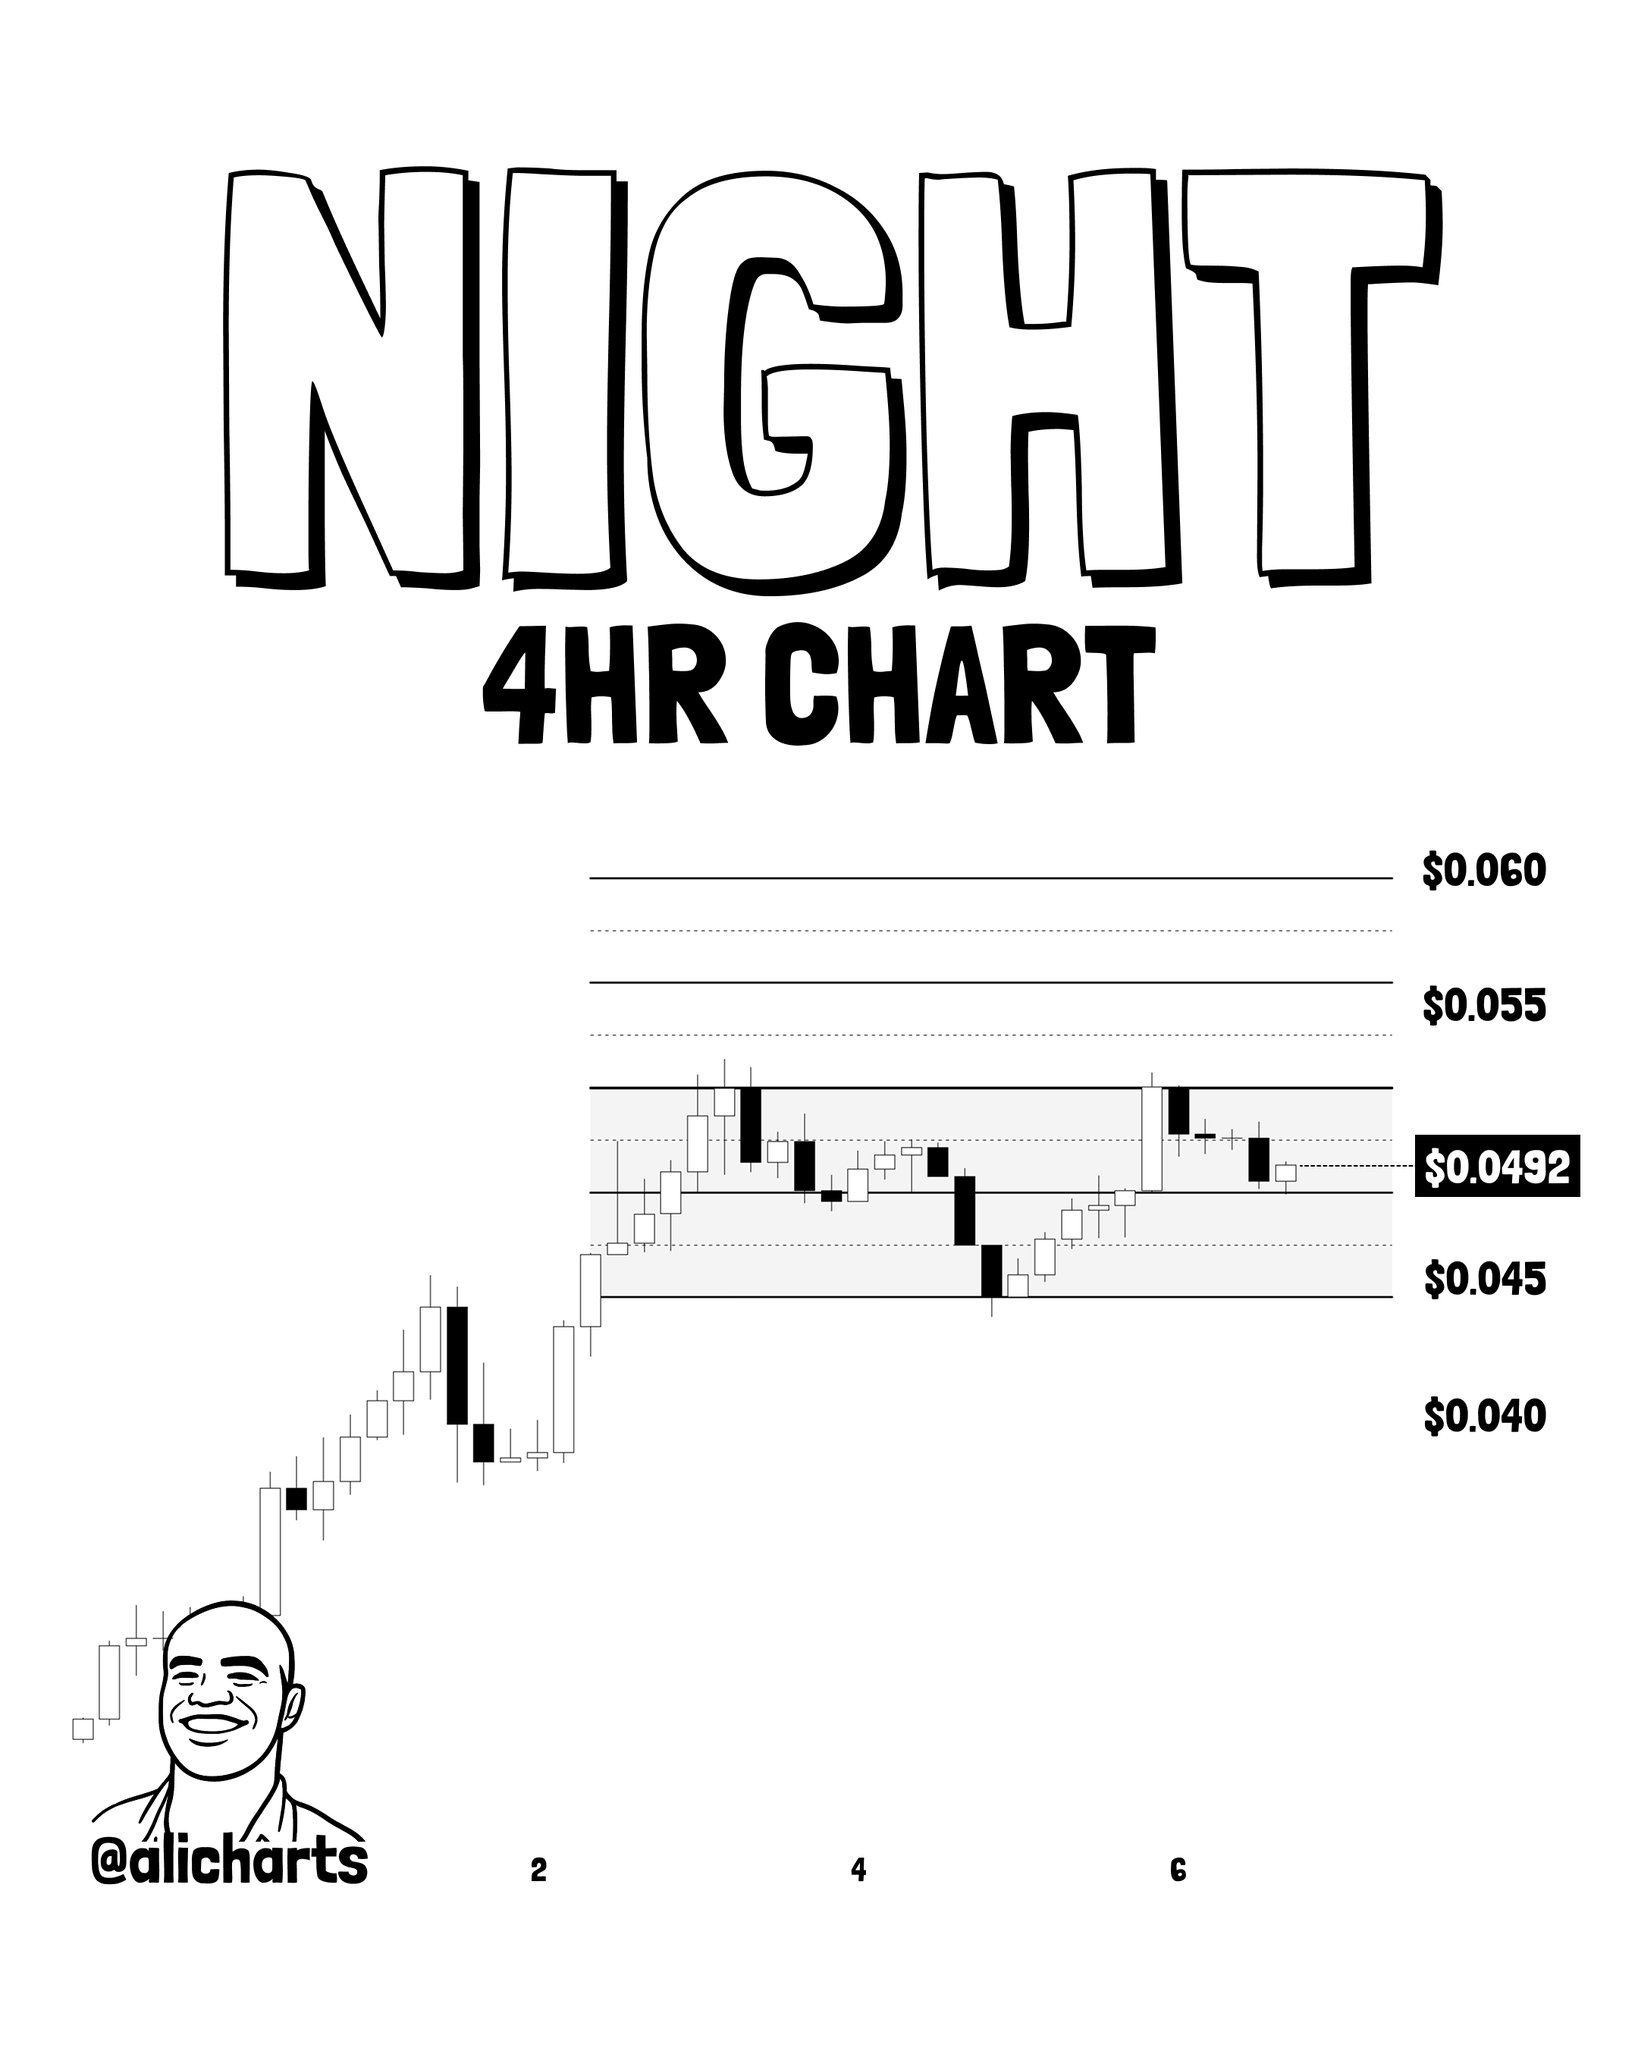
Chart Analysis | Source: @alicharts (X)
The trigger is unambiguous: Martinez states that a four-hour close above $0.052 is the confirmation level. That candle close — not an intraday wick — would signal a breakout from the consolidation range and open the path higher. Without that close, $NIGHT remains in a defined range with resistance intact. A breakdown below the lower channel boundary near $0.045 would negate the bullish structure and expose the $0.040 level as the next reference point.
Bullish Scenario
A four-hour close above $0.052 confirms the range breakout. This is the level Martinez explicitly identifies as the trigger for continuation of the rally that began at $0.032.
Bearish Scenario
Failure to close above $0.052 on a four-hour basis, followed by a break below $0.045, would invalidate the range support and put the $0.040 level in focus.
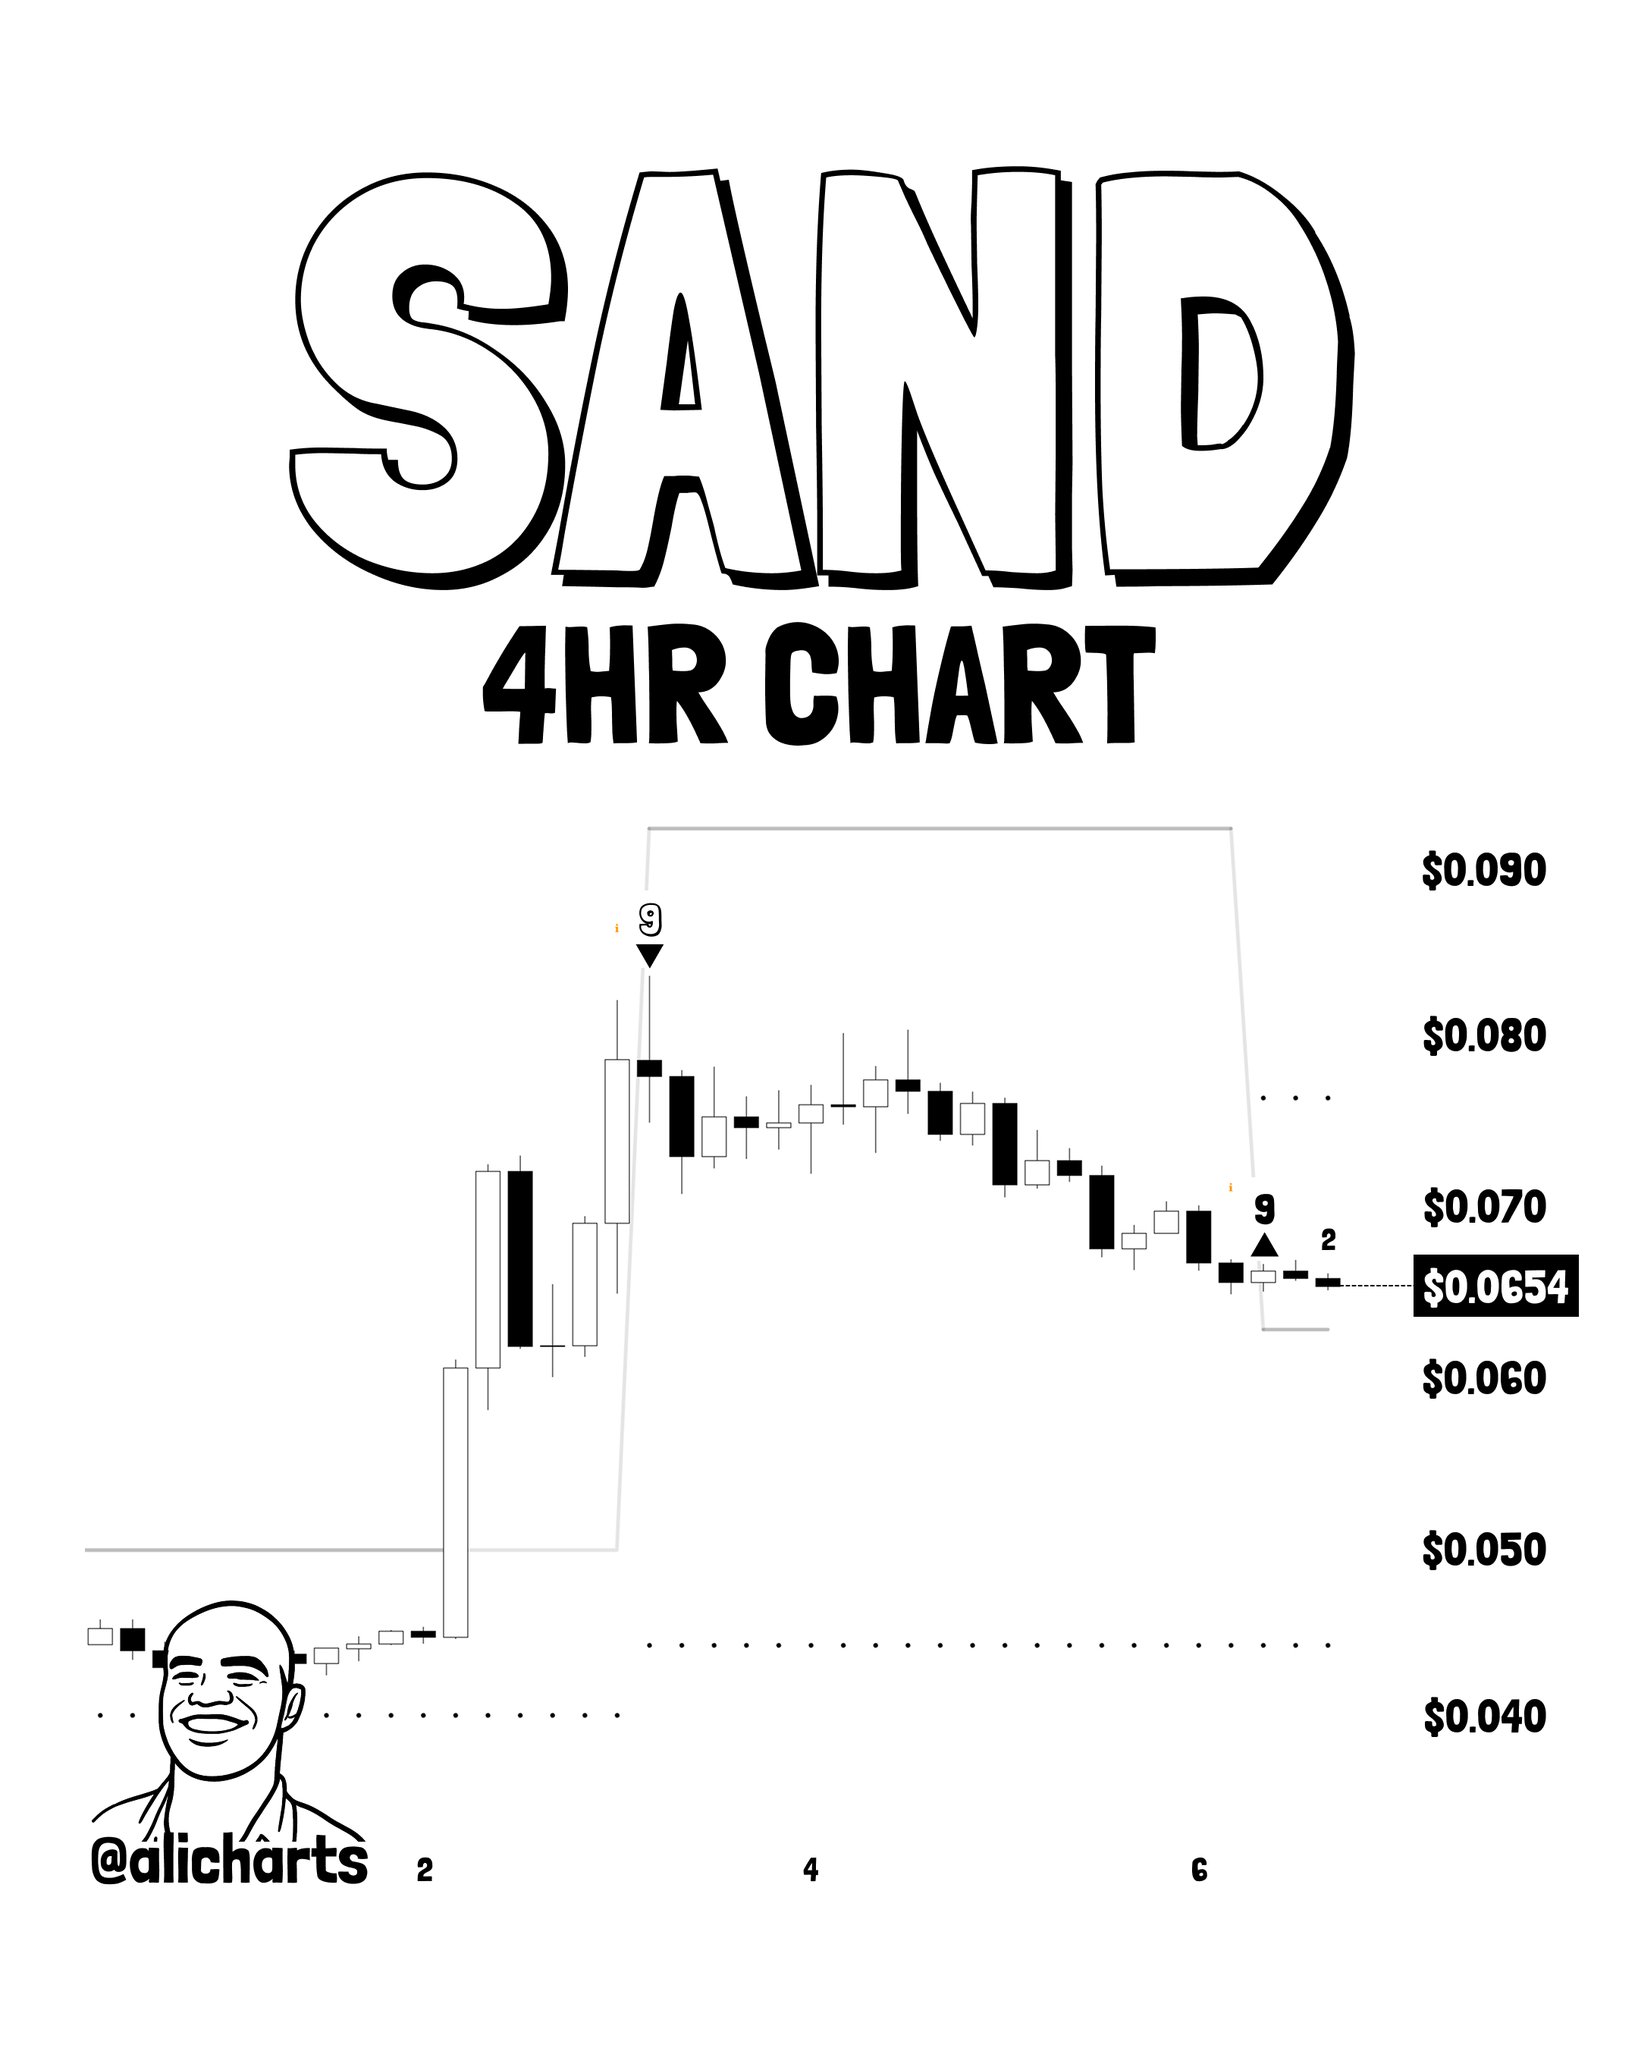
The Sandbox gained approximately 52% over the same seven-day period, rising from $0.043 to around $0.065. At the time of writing, SAND is trading at approximately $0.0654. The rally was preceded and then interrupted by a TD Sequential sell “9” signal that appeared near the October 3 high — a bearish exhaustion count that correctly foreshadowed the pullback from the peak.
Now the chart shows the opposite signal. The 4-hour SAND chart flagged by @alicharts prints a TD Sequential buy “9” near the recent low, with the count now progressing to “2.” The TD Sequential counts nine consecutive bars closing lower to identify momentum exhaustion — not a support level, but a signal that selling pressure has run its course. The prior sell “9” at the top was accurate. The buy “9” at the bottom now raises the question of a symmetrical reversal.
Source: @alicharts (X)
The chart shows a rectangular box marking the prior high range, with a dotted horizontal line near the $0.040–$0.045 zone serving as a reference below current price. The count progression to “2” means the buy signal is in its early confirmation phase — a move back toward the prior high range near $0.080–$0.090 would be the natural target if the signal plays out. However, TD Sequential signals are exhaustion indicators, not guarantees — the count can reset if price makes a new low before the signal matures.
Bullish Scenario
The TD Sequential buy “9” matures as the count progresses past “2” without a new low. Price holds above the $0.040–$0.045 reference zone and begins recovering toward the prior high range near $0.080.
Bearish Scenario
A new low below the buy “9” candle resets the count, invalidating the exhaustion signal. The dotted reference line near $0.040 becomes the next area of interest.
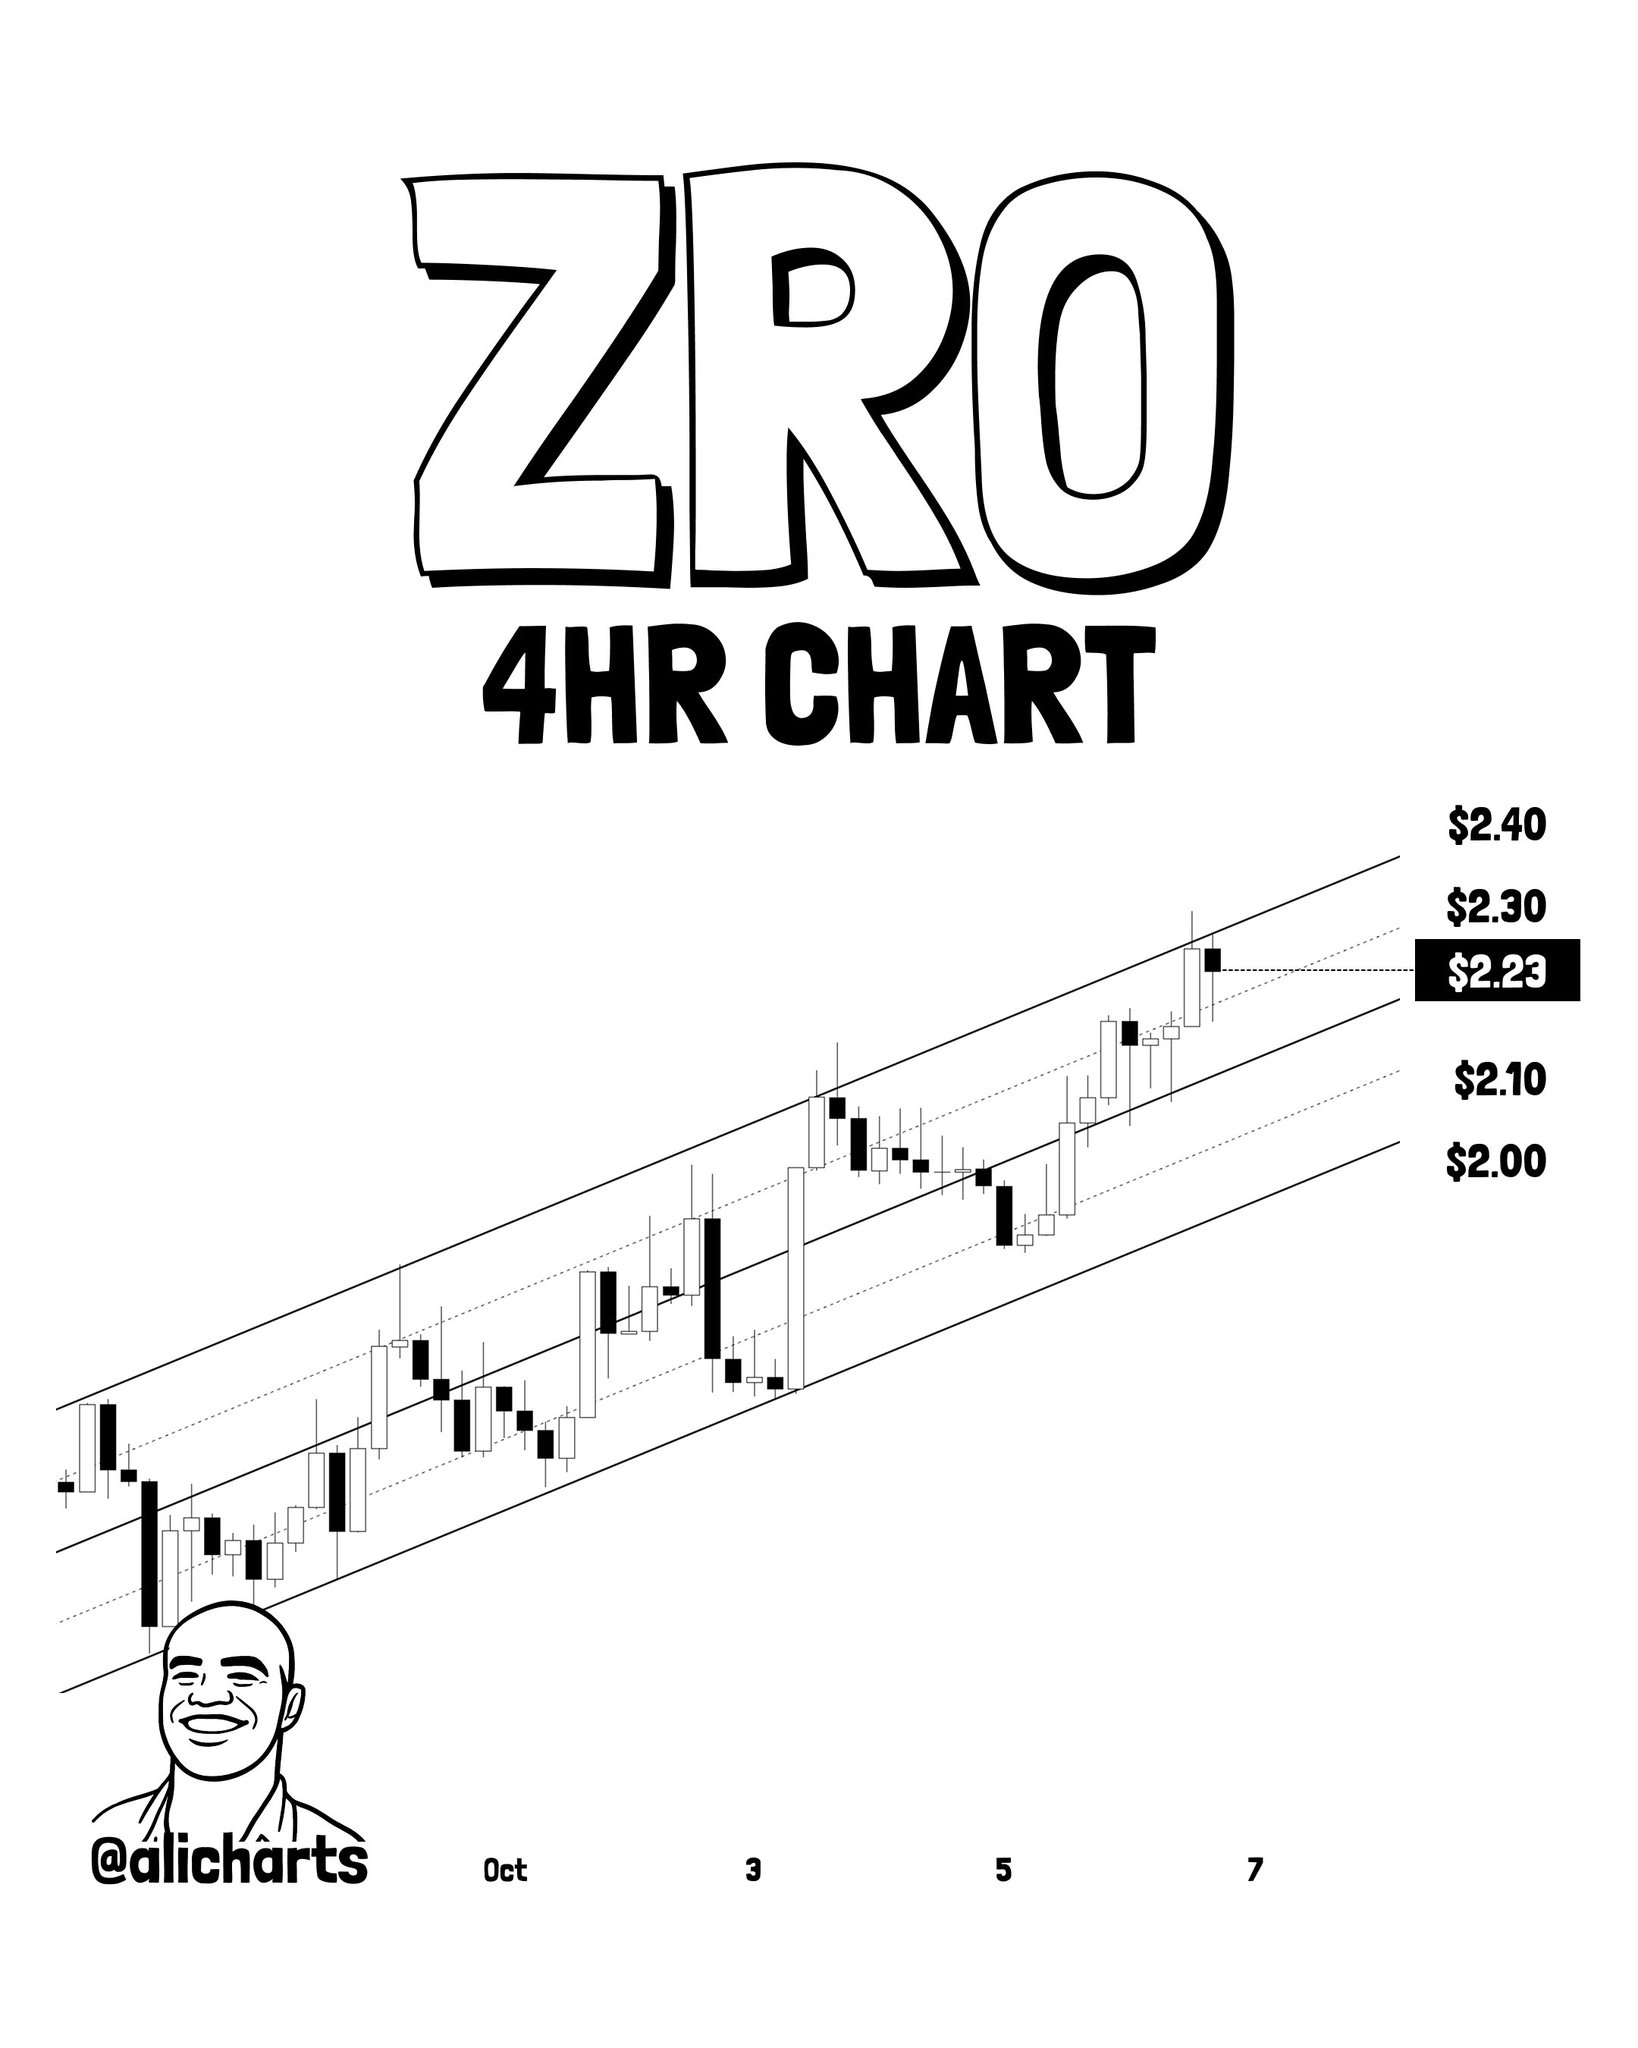
LayerZero is trading at approximately $2.23 at the time of writing — and the 4-hour chart flagged by @alicharts shows ZRO pressing against the upper boundary of a clearly defined rising parallel channel. The channel spans the October 1–7 period with ascending price action bounded by two solid diagonal lines and a dashed midline.
Source: @alicharts (X)
The setup is a mean-reversion thesis within an ascending structure. ZRO has trended upward through the channel, but the current candles are approaching the upper boundary — the zone where prior touches have produced pullbacks toward the midline or lower boundary. Price labels on the chart run from $2.00 at the lower boundary to $2.40 at the upper boundary, with $2.10 and $2.30 as intermediate references. The analyst’s framing is that the upper channel boundary at current price levels represents a potential rejection point.
This is not a bearish call on ZRO’s broader trend — the channel itself is rising. It is a setup for a mean-reversion trade: rejection from the upper boundary sends price back toward the midline or lower boundary of the ascending structure. A sustained close above the upper boundary, however, would represent a breakout from the channel entirely and shift the setup from mean-reversion to continuation.
Bullish Scenario
ZRO closes above the upper channel boundary near $2.30–$2.40 on a four-hour basis, invalidating the mean-reversion setup and opening a channel breakout continuation move.
Bearish Scenario
Rejection from the upper boundary near $2.23–$2.30 sends ZRO back toward the channel midline near $2.10 or the lower boundary near $2.00.
What Martinez’s thread presents is not a single thesis — it is three structurally distinct setups. NIGHT is a range-consolidation breakout watch: the trigger is a four-hour close above $0.052. SAND is an exhaustion-reversal setup: the TD Sequential buy “9” mirrors the sell “9” that correctly called the top, now with the count at “2” and progressing. ZRO is a channel mean-reversion setup: price at the upper boundary with the question of rejection versus breakout unresolved.
Each setup has a specific invalidation. None of the three is a directional call without conditions. Traders watching these assets this week — alongside broader altcoin momentum tracked across other analyst-flagged setups and the OTHERS index structure — have specific binary levels to watch rather than directional opinions to hold.
The Bitcoin Puell Multiple hitting an 11-month high this week adds macro context: altcoin setups like these emerge in environments where Bitcoin’s miner revenue dynamics are shifting — a condition that historically precedes broader altcoin rotation.
For NIGHT, the line is $0.052 on a four-hour close. For SAND, the TD Sequential count at “2” must advance without a new low. For ZRO, the upper channel boundary near $2.23–$2.30 is the decision zone — and whichever side price breaks from will define the next directional leg for all three assets.
Disclaimer: The views and analysis presented in this article are for informational purposes only and reflect the author’s perspective, not financial advice. Technical patterns and indicators discussed are subject to market volatility and may or may not yield anticipated results. Investors are advised to exercise caution, conduct independent research, and make decisions aligned with their individual risk tolerance.
Read Also: Bitcoin Exchange Netflow Stays Deeply Negative — What the 30-Day SMA Is Saying