Can ARB climb back to $0.2562 before November ends, or does $0.1486 break first? $ARB sits at $0.162 today, down 1.7% in 24h. That's the starting point for this Arbitrum price prediction Nove
Can ARB climb back to $0.2562 before November ends, or does $0.1486 break first?
$ARB sits at $0.162 today, down 1.7% in 24h. That's the starting point for this Arbitrum price prediction November 2026.
Fresh Security Council headlines add another layer, and thelatest crypto news covers the wider market.
Arbitrum 24-Hour Market Data
CoinGecko market data captured at 9:20 UTC on Oct 30, 2026, shows $ARB at $0.162.
Metric
Value
Price
$0.162
24h change
-1.7%
Market cap
$1.117B
FDV
$1.62B
24h volume
$260.103M
Circulating supply
6.892B
Total supply
10B
CoinGecko market snapshot of $ARB, captured at 9:20 UTC on Oct 30, 2026.
FDV is token price times the full 10B supply. That $1.62B FDV is 1.45x the market cap.
About 31.1% of the 10B supply isn't circulating yet, so later releases add supply to a sliding market.
Arbitrum Security Council News Freezes 74.56M ARB
The Security Council is Arbitrum's emergency group. A frozen wallet is an address whose tokens only that group or a DAO vote can move.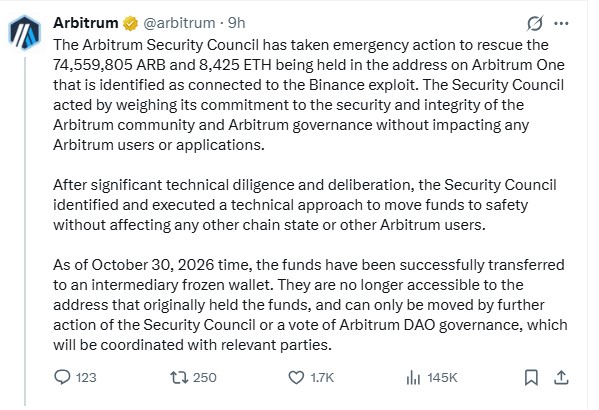
Official Arbitrum X post on the Security Council action, captured at 9:20 UTC on Oct 30, 2026.
Per the Arbitrum X post, the group moved 74,559,805 ARB and 8,425 ETH into an intermediary frozen wallet.
The post ties them to the Binance exploit. Only Security Council action or a DAO vote can move them now.
If a release comes, 74.56M ARB, or 1.08% of circulating supply, changes hands.
If no vote comes, the tokens stay frozen and the supply is unchanged. $ARB still traded 1.7% lower over 24h.
ARB Price Forecast After a 20.07% Monthly Slide
Coinglass price performance data, captured at 9:20 UTC on Oct 30, 2026, shows ARB down 9.27% over 7 days and 20.07% over 30 days.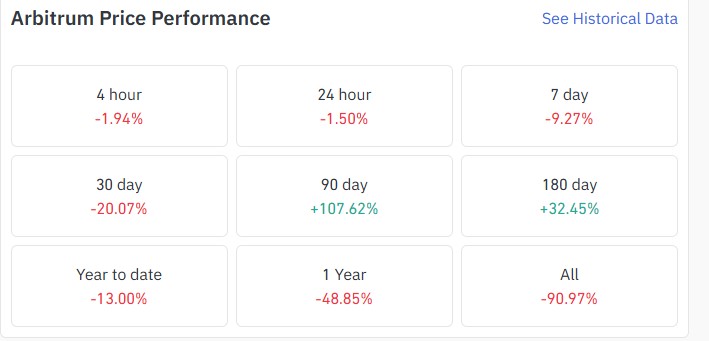
Coinglass price performance table of $ARB, captured at 9:20 UTC on Oct 30, 2026.
Price sits 8.2% above the 24h low and 7.7% below the 24h high.
A 107.62% gain over 90 days reads bullish at first glance. But the shorter windows say sellers run the current leg.
ARB Price Forecast Risk From 47.08% Whale Concentration
Arbiscan holder data, captured at 9:20 UTC on Oct 30, 2026, puts 47.08% of supply in the top 10 wallets.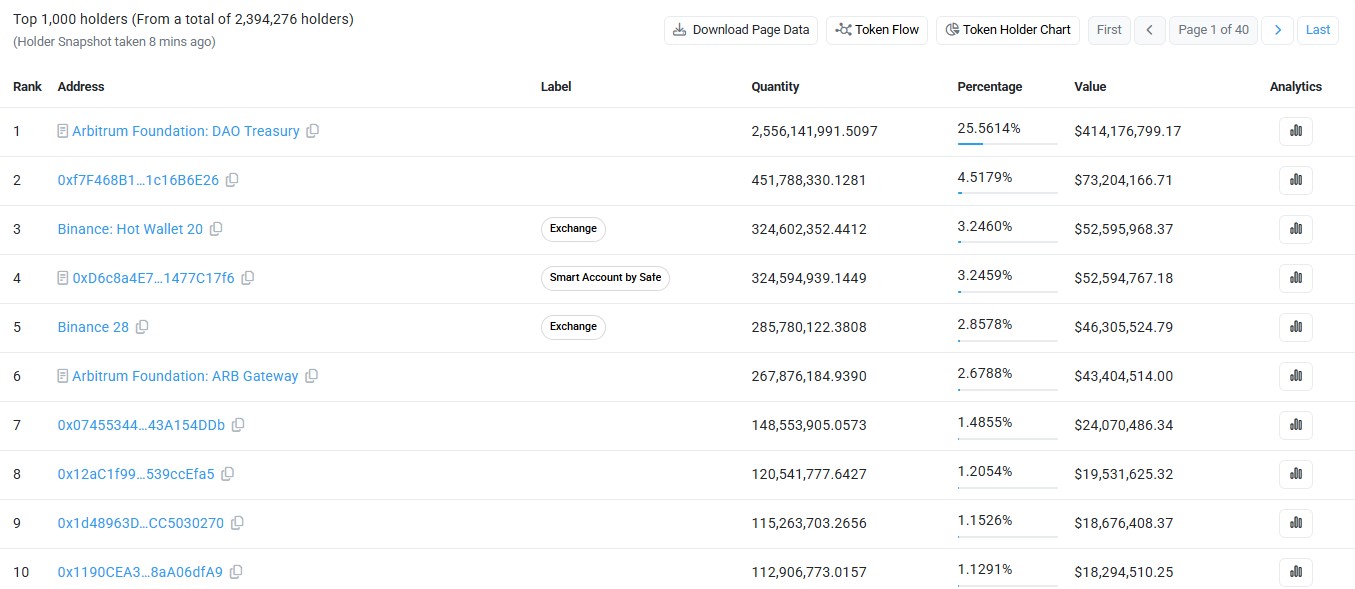
Arbiscan top holders of $ARB, captured at 9:20 UTC on Oct 30, 2026.
The Arbitrum Foundation DAO Treasury alone holds 25.56%, worth $414.18M. Without it, the next 9 wallets hold 21.52%.
Two Binance wallets hold 6.10%, and exchange balances can reach the order book fast.
ARB Liquidation Data Shows Longs Took 88.2% of Losses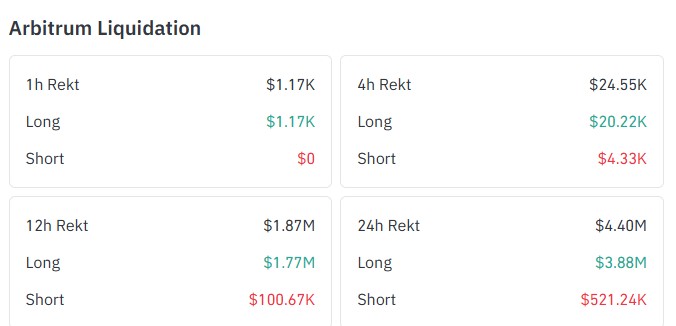
Coinglass liquidation data , captured at 9:20 UTC on Oct 30, 2026.
Longs lost $3.88M against $521.24K for shorts. Over the last 12h, longs lost $1.77M of the $1.87M total.
Forced selling adds supply to a falling tape. And the 1h total of $1.17K, all longs, shows the flush has cooled.
ARB Open Interest and Futures Volume Favor Binance
Open interest is the value of futures contracts still open.
CoinGecko lists $401.259M in perps open interest at the same capture time.
Per theCoinglass volume heatmap, captured at 9:20 UTC, Binance leads ARB futures volume at $167.74M.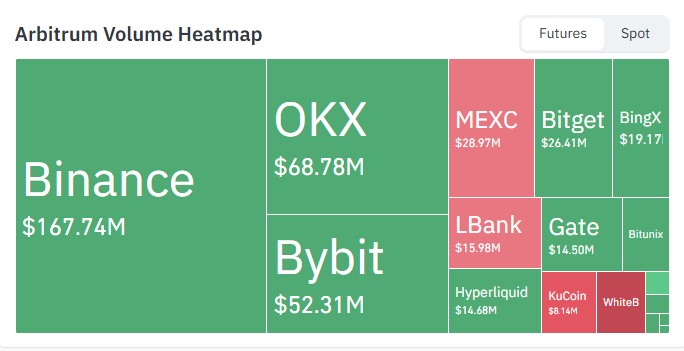
Coinglass futures volume heatmap of $ARB, captured at 9:20 UTC on Oct 30, 2026.
OKX follows at $68.78M, a gap of $98.96M.
With Binance trading 2.44x the volume of OKX, price swings on that venue tend to set the pace elsewhere. Earlier catalysts sit in theStandard Chartered ARB news report.
Arbitrum Price Prediction November 2026 on the Daily Chart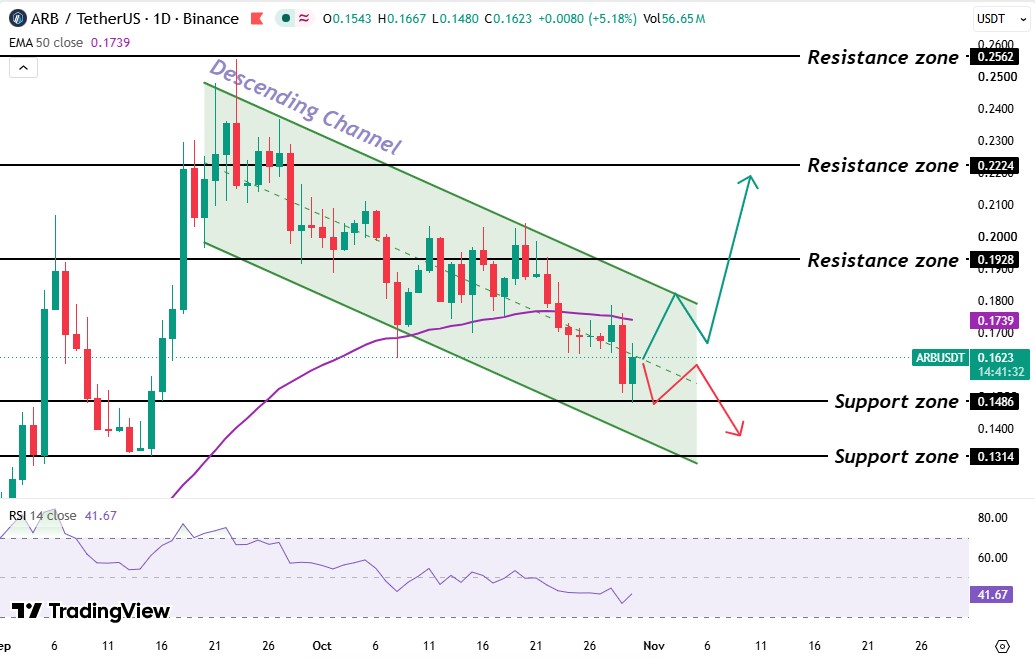
TradingView $ARB/USDT 1D chart on Binance, captured at 9:20 UTC on Oct 30, 2026.
In the chart, the price took the $0.1314 level support in early September and did a breakout above the $0.1928 level on Sep 6, 2026, but Price didn't hold that level and closed below the $0.1928 level.
After that, the price slowly started going downward near the $0.1314 level, and after that, a big breakout happened on 14 Sep, 2026, and the price tested the $0.2562 resistance level on Sep 23, 2026.
After that price started going downward by making lower highs and lower lows and formed a descending channel, meaning a series of lower highs and lower lows inside two falling lines, formed after that peak.
Right now the price is trading right above the $0.1486 level. Resistance history appears in theearlier ARB resistance analysis.
The 50-day EMA sits at $0.1739. Price trades below it; buyers need to break the 50 EMA level first.
RSI reads 41.67. That sits below the 50 midpoint, so sellers hold a slight edge.
$ARB Support and Resistance Levels
Level
Price
Resistance
$0.2562
Resistance
$0.2224
Resistance
$0.1928
50-day EMA
$0.1739
Support
$0.1486
Support
$0.1314
Support is where buyers have stepped in, resistance where sellers have. The nearest levels are $0.1486 below and $0.1739 above.
Arb Price Forecast: Bull, Base and Bear Scenarios
Scenario
Trigger
Target
Invalidation
Bull
Daily candle trades above $0.1739
$0.1928, then $0.2562
Rejection at $0.1739
Base
Holds $0.1486, stalls near $0.1739
$0.1486 to $0.1739
Daily candle trades below $0.1486
Bear
Daily candle trades below $0.1486
$0.1314
Daily candle trades above $0.1739
Bulls need to reclaim 50 EMA first, then the $0.1928 level. A reclaim of $0.2562 needs a 58.15% gain, while the bear target sits 18.89% lower.
Arbitrum price prediction November 2026: Expert Outlook
As per CoinGabbar analysis, the Arbitrum price prediction November 2026 stays bearish below the 50-day EMA at $0.1739 and turns bullish above it. Long losses of $3.88M show buyers still need strong volume.
A daily candle trading above $0.1739 opens $0.1928 and builds the case for $0.2562. Below $0.1486, the bounce case ends.
Disclaimer: This article is for information only and isn't financial advice. Traders should do their own research and risk only what they can afford to lose.