The mismatch behind the rally About 45% ARB’s seven-day gain $43.2 million Robinhood Chain’s 30-day revenue 10% Ecosystem share of net protocol revenue No automatic payout ARB holders govern
The mismatch behind the rally
About 45%ARB’s seven-day gain
$43.2 millionRobinhood Chain’s 30-day revenue
10%Ecosystem share of net protocol revenue
No automatic payoutARB holders govern but receive no distribution
The $43 million total hides a slowing daily pace
Token Terminal attributed $43.2 million in revenue to Robinhood Chain during the 30 days ending September 18. The figure shows that a network built with Arbitrum technology can produce substantial revenue outside Arbitrum One.
The daily bars provide a less settled picture. Revenue accelerated at the end of August, briefly approached $8 million in early September and then fell below $1 million in the latest sessions shown on the chart.
The trailing total therefore shows what Robinhood Chain can generate during a surge, not what it will necessarily earn every month. A 30-day sum can remain elevated after the activity that produced it has already slowed.
Another test is approaching. Robinhood has subsidized gas for eligible trades made through its official wallet, with that support reportedly scheduled to end around late September. Activity after the subsidy expires should offer a clearer indication of how much demand remains when users bear more of the transaction cost themselves.
Robinhood Chain revenue does not become ARB income
Robinhood Chain is built with Arbitrum Dedicated Blockchains, a framework that allows companies to launch customized Layer 2 networks using Arbitrum technology.
Under the Arbitrum Expansion Program, participating networks contribute 10% of their net protocol revenue to the Arbitrum ecosystem. Eight percentage points go to the DAO treasury and two support the developers maintaining the technology.
How the revenue connection works
Robinhood Chain generates net protocol revenue
↓
10% enters the Arbitrum ecosystem
↓
8% to the DAO treasury
2% to developers
↓
No automatic ARB distribution, burn or buyback
The reported $43.2 million cannot simply be multiplied by 10% to calculate Arbitrum’s income. The agreement applies to net protocol revenue, while analytics providers may treat fees, operating costs and revenue differently.
Robinhood Chain also uses ETH as its gas token. More transactions can increase the network’s income without requiring users to buy ARB. The token’s connection comes through governance: ARB holders can vote on the use of the DAO treasury, but voting power is not the same as receiving cash flow.
Why traders may still connect the revenue to ARB
Arbitrum now has evidence for its business model
Robinhood Chain strengthens the case that Arbitrum can earn from companies using its technology to build separate networks. Income does not have to depend entirely on transactions taking place on Arbitrum One.
The treasury gives ARB an indirect link
Revenue paid to the DAO can finance development, incentives or investments intended to expand the ecosystem. If those decisions attract more projects and income, control over the treasury could become more valuable.
There is still no guarantee that a larger treasury will increase ARB’s price. Spending can fail to produce returns, and token holders cannot redeem ARB for a proportional share of treasury assets.
Traders may be anticipating a future mechanism
Standard Chartered placed the missing value connection at the center of its recent Arbitrum coverage. The bank reportedly set a $10 target for 2030 while also identifying ARB’s lack of direct revenue accrual as a risk to that forecast.
The report may have encouraged traders to price the possibility of a future buyback, distribution or another value-capture mechanism. None follows automatically from the existing agreement.
The timing also overlaps with a wider cryptocurrency rebound. The recent examination of why the altcoin rally had not yet become an altseason found improving participation across several sectors. Robinhood Chain may have strengthened the case for ARB, but the token was not rising in isolation.
READ MORE:
 Altcoins Rally – Why Altseason Is Not Here Yet?
The rally has reached the floor ARB lost
On September 19, ARB traded near $0.21 after gaining about 45% over seven days and briefly reaching $0.23 on the Coinbase ARB/USD chart.
On the weekly chart, the $0.21-$0.23 area supported ARB during late 2025. Its breakdown was followed by a decline below $0.10 in 2026. Price is now approaching that former floor from below, which can turn it into resistance.
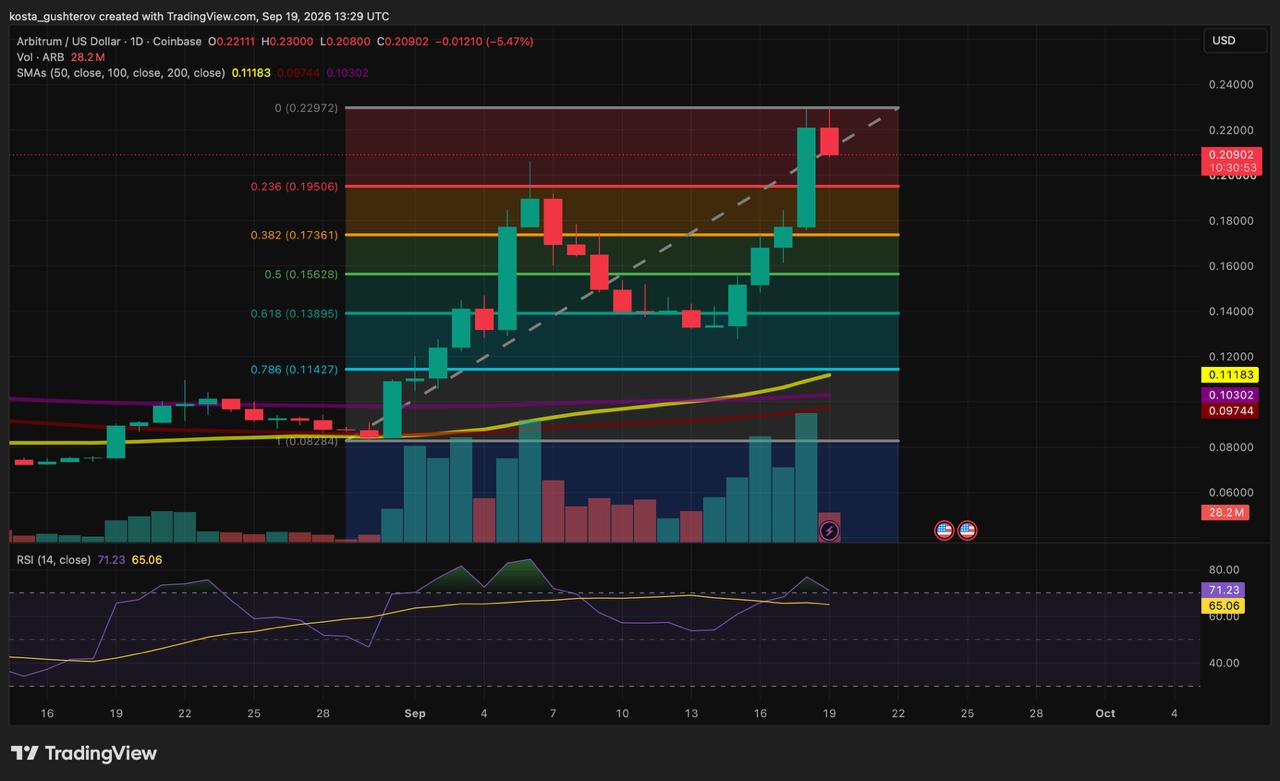
ARB returns to the $0.21-$0.23 area that acted as support before its 2026 decline. Source: TradingView.
ARB has reclaimed its 50-week moving average near $0.15, but the 100-week average remains considerably higher around $0.33. Buyers first need to clear the former floor before that longer-term average becomes relevant.
$0.23 has triggered an intraday pullback
ARB touched $0.23 before retreating toward $0.21. Because the daily candle remained open, the move showed selling around resistance but not a confirmed rejection.
Daily RSI reached approximately 71, meaning the rally entered traditionally overbought territory as price encountered weekly resistance. That reading does not require an immediate decline. It shows that the gains arrived unusually quickly, making the response to the first pullback more informative.
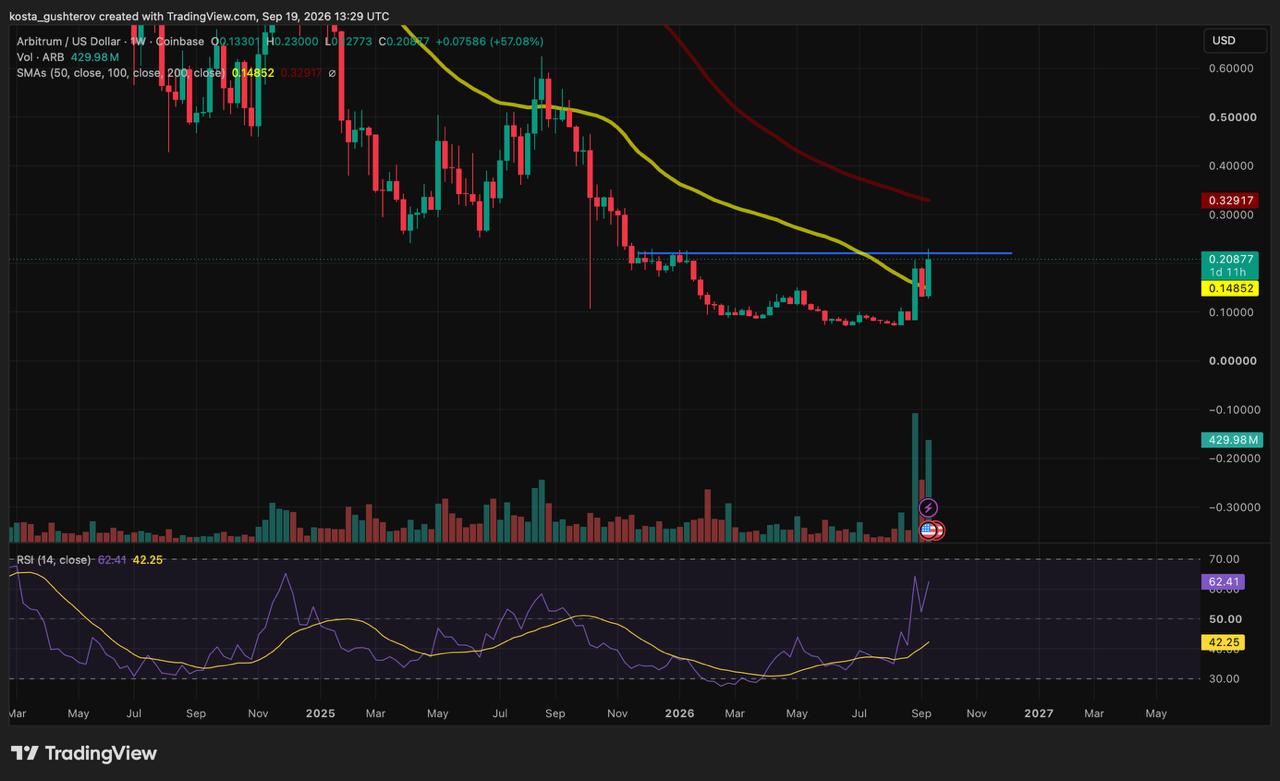
ARB pulls back after touching $0.23, leaving $0.20 as the first measured support. Source: TradingView.
How the next move would change the setup
Daily close above $0.23ARB would clear the recent high and the upper edge of its former weekly support area.
Pullback holds around $0.20The 23.6% retracement would preserve most of the advance and provide the first evidence of support above the previous range.
Price falls below $0.17Losing the 38.2% retracement would place the breakout under pressure and expose the $0.15-$0.16 area.
Price returns below $0.15A loss of the reclaimed 50-week average would remove an important part of the recovery structure.
ARB is pricing a possibility, not receiving cash flow
Robinhood Chain has shown that Arbitrum’s technology can support a revenue-producing business. What remains unproven is whether that success will give ARB holders more than governance over a larger ecosystem treasury.
The more useful tests now are whether Robinhood Chain’s daily revenue stabilizes after its initial surge and whether the DAO creates a clearer connection between ecosystem income and the token. Until then, the reaction around $0.23 will show how much traders are prepared to pay for that possibility before ARB’s economics catch up.
This article is provided for informational purposes only and does not constitute financial or investment advice. Cryptocurrency prices, network revenue and technical indicators can change rapidly.
The post Arbitrum’s 45% Rally May Price In Revenue ARB Does Not Receive appeared first on Coindoo.