Arthur Hayes has sold 6,000 Ethereum at a loss after accumulating nearly $10.6 million worth of ETH in recent days, even as other large investors continue adding to their holdings around a ma
Arthur Hayes has sold 6,000 Ethereum at a loss after accumulating nearly $10.6 million worth of ETH in recent days, even as other large investors continue adding to their holdings around a major support zone.
Summary
- Arthur Hayes sold 6,000 ETH at a $606,000 loss after accumulating nearly $10.6 million worth of Ethereum days earlier.
- Lookonchain data shows K3 Capital and a Chun Wang-linked wallet acquired more than 17,000 ETH despite recent weakness.
- Technical indicators and liquidation data place Ethereum at a critical support zone near $1,700, with major liquidity sitting around $1,800.
According to blockchain tracking platform Lookonchain, the BitMEX co-founder accumulated approximately 5,900 ETH over the past few days at an average purchase price of $1,793 per token. Data shared by the platform showed that Hayes later sold 6,000 ETH for roughly $10.14 million at an average price of $1,690, locking in an estimated loss of about $606,000.
The transaction comes as Ethereum struggles to regain momentum after failing to hold above key resistance levels during a recent recovery attempt. ETH was trading near $1,700 at the time of writing, well below its April peak above $2,400.
As reported by crypto.news earlier, a wallet linked to Hayes received 3,000 ETH worth approximately $5.42 million from market maker Flowdesk on June 15. The transfer took place as Ethereum and the wider crypto market rallied after easing geopolitical tensions in the Middle East improved investor sentiment at that time.
You might also like: John Boozman reveals why CLARITY Act faces Senate resistance
Why are some large investors still accumulating ETH?
While Hayes reduced exposure, on-chain data cited by Lookonchain points to continued buying activity among other major holders.
The platform reported that investment firm K3 Capital withdrew 10,000 ETH worth approximately $16.9 million from Binance. Separately, a wallet linked to entrepreneur Chun Wang acquired another 7,650 ETH valued at nearly $12.9 million.
These purchases arrived as Ethereum was testing an area that several technical indicators identify as an important support zone. On the daily chart, Ethereum (ETH) remains close to the 78.6% Fibonacci retracement level near $1,703, a level traders often monitor for potential trend stabilization following steep corrections.
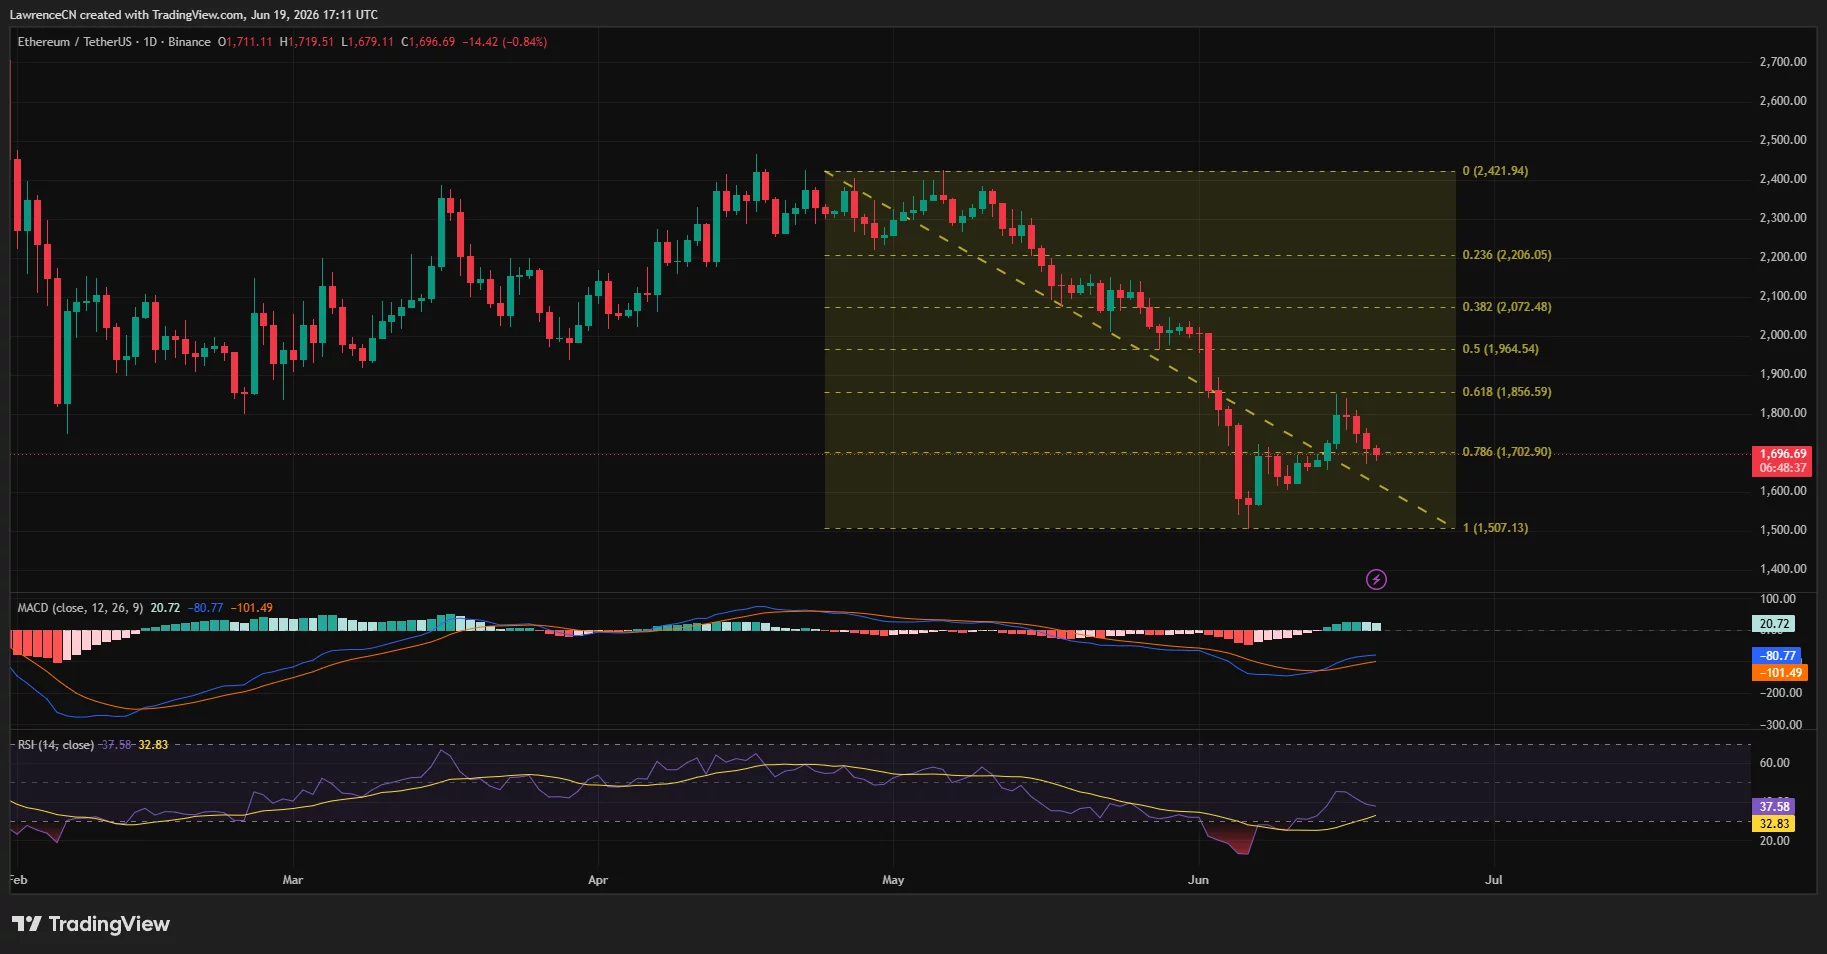
Ethereum daily price chart — June 19 | Source:
crypto.newsRecent price action has produced mixed signals. Although Ethereum rebounded from its June low near $1,507, the recovery stalled below the 61.8% Fibonacci retracement level around $1,856.
Daily RSI remains below the neutral 50 mark, while the MACD indicator is still positioned beneath the zero line, suggesting that buyers have yet to establish a sustained reversal.
Where could Ethereum move next?
Liquidation data indicates that leveraged traders are heavily positioned around several nearby price zones.
CoinGlass liquidation heatmaps show notable liquidity clusters between $1,780 and $1,820, with one of the largest concentrations sitting near the $1,800 level. Such areas often attract price movement as traders seek liquidity and leveraged positions are forced to close.
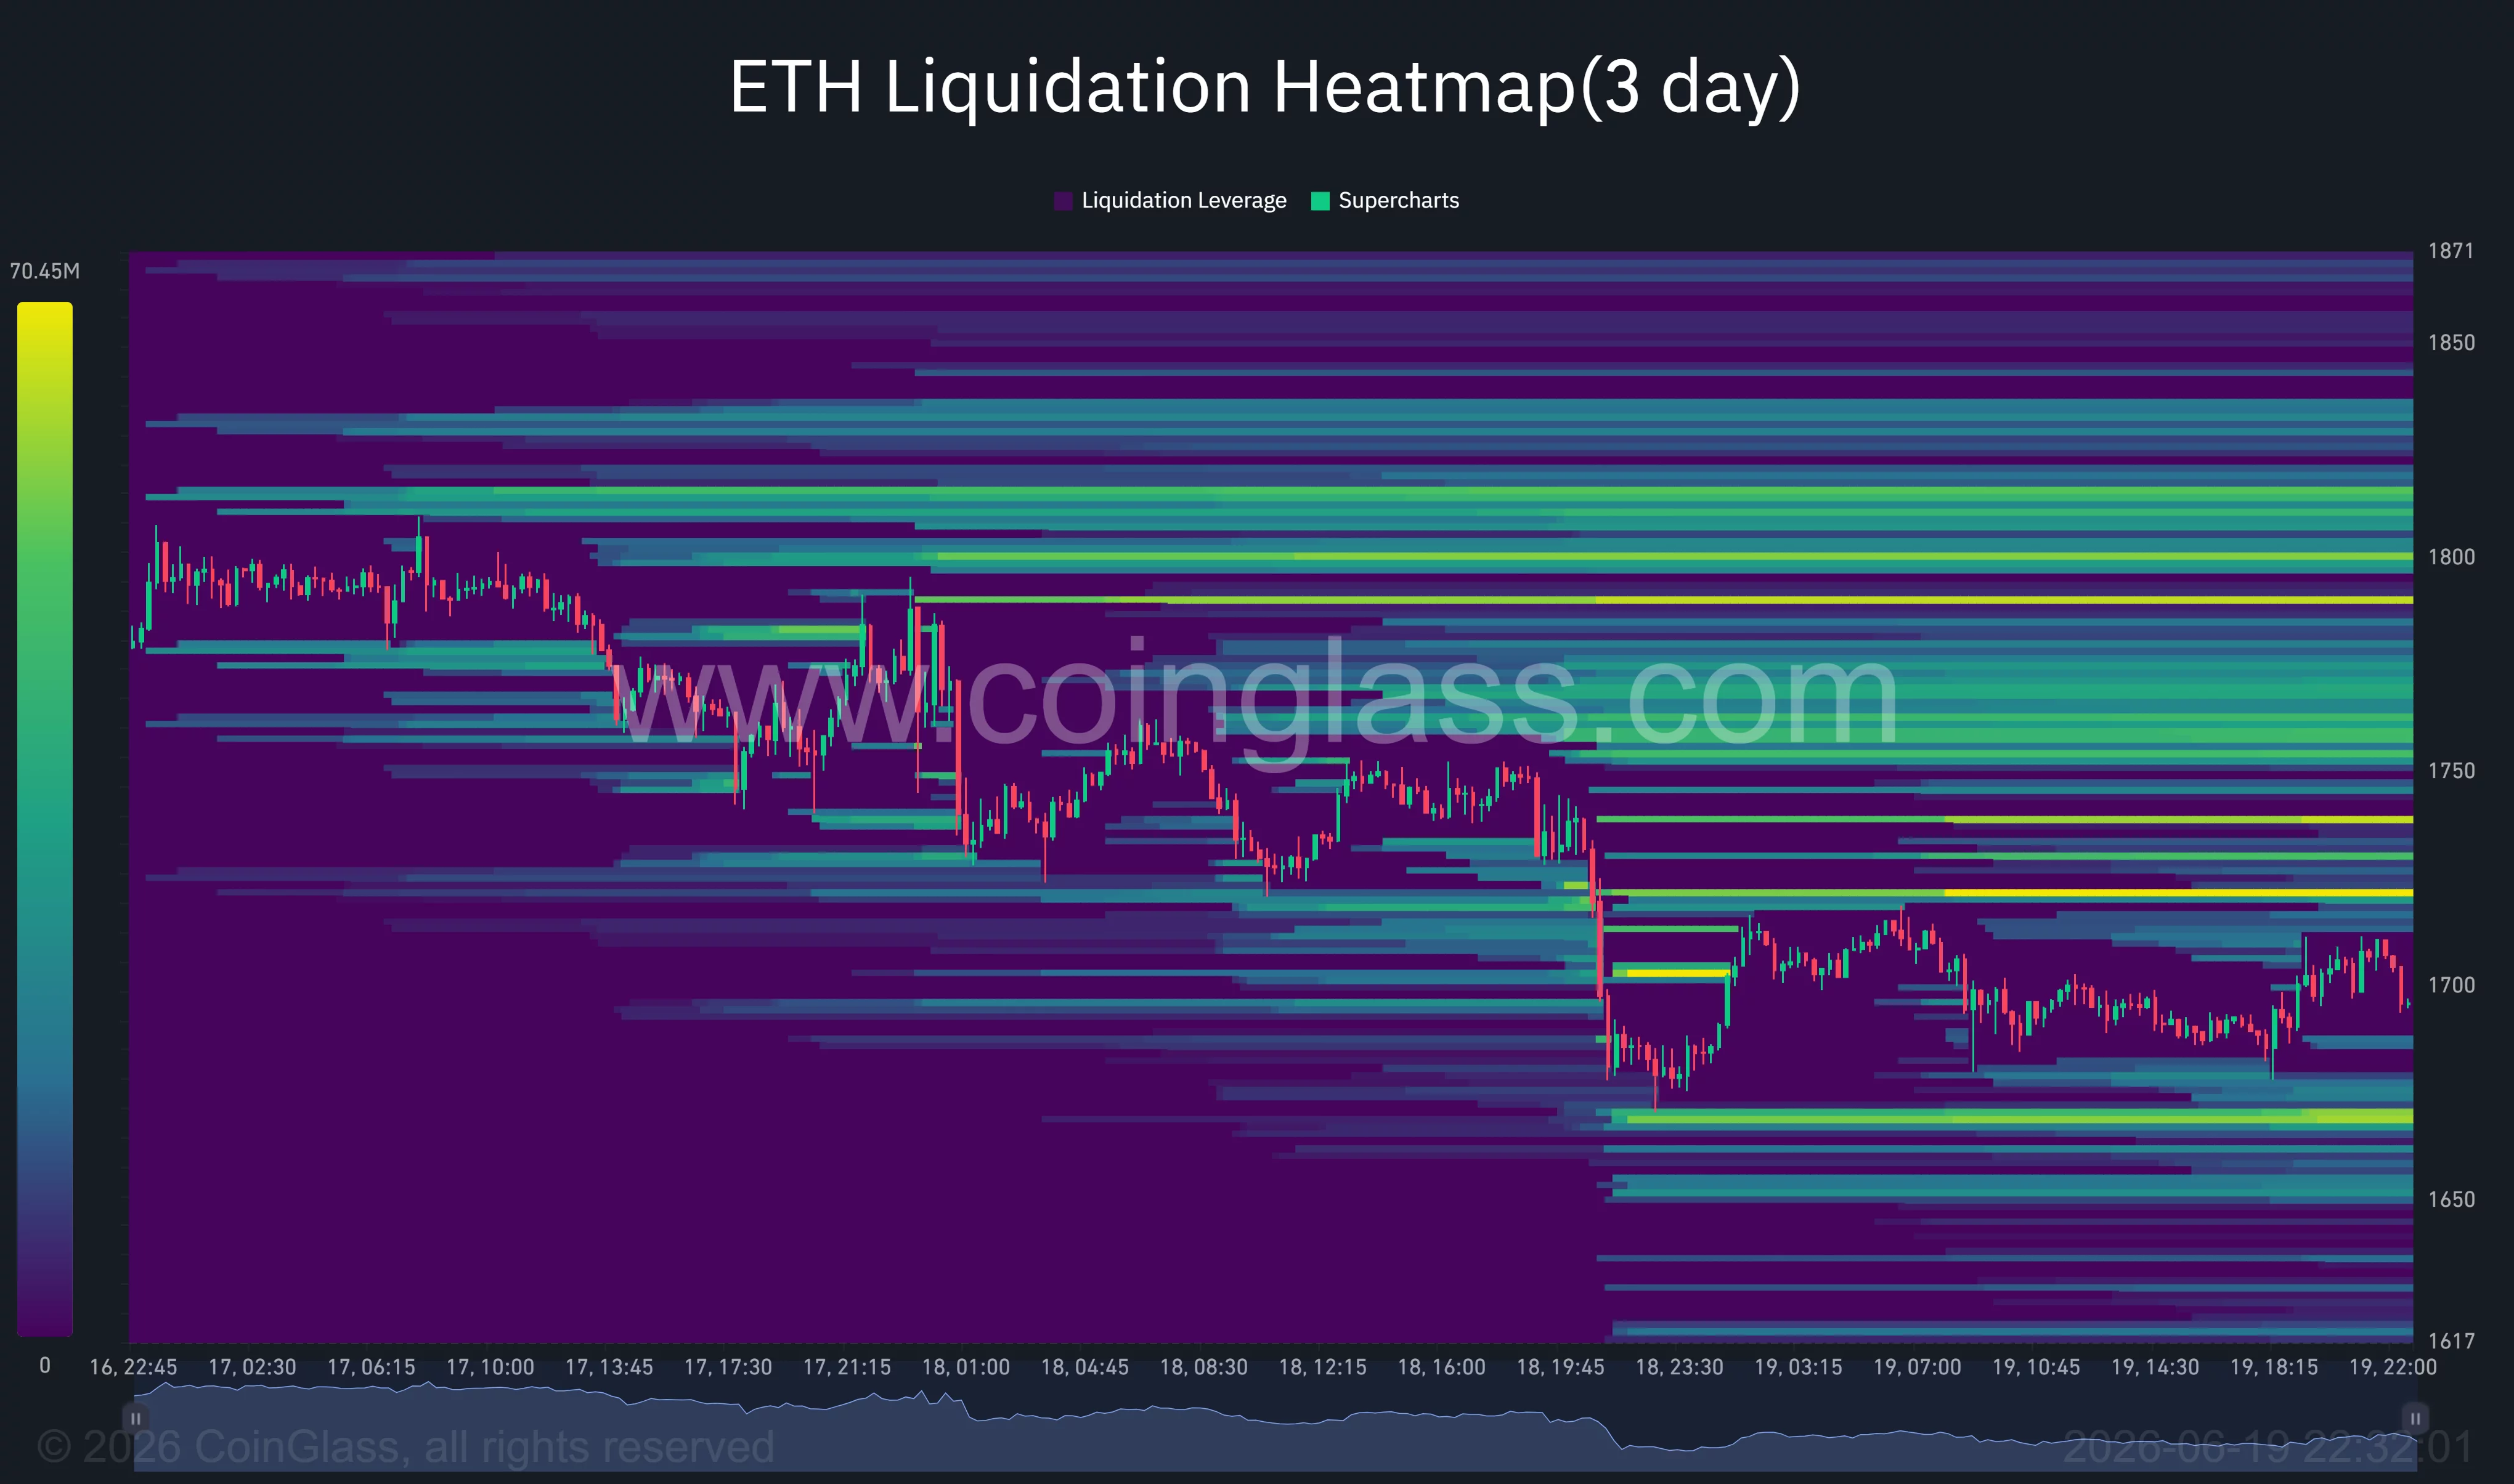
Ethereum liquidation heatmap | Source:
CoinGlassAdditional technical analysis shared by market commentator Team LAMBO suggests Ethereum recently faced rejection from a confluence resistance area tied to Fibonacci levels and descending trendline resistance.
In a June 19 X post, the analyst argued that a clear trading range has developed between roughly $1,500 and $1,800, with a breakout beyond either boundary likely determining the next significant move.
The 4-hour chart presents a similar picture. Ethereum remains below a descending trendline that has capped rallies since early May, while the Supertrend indicator continues to signal bearish conditions.
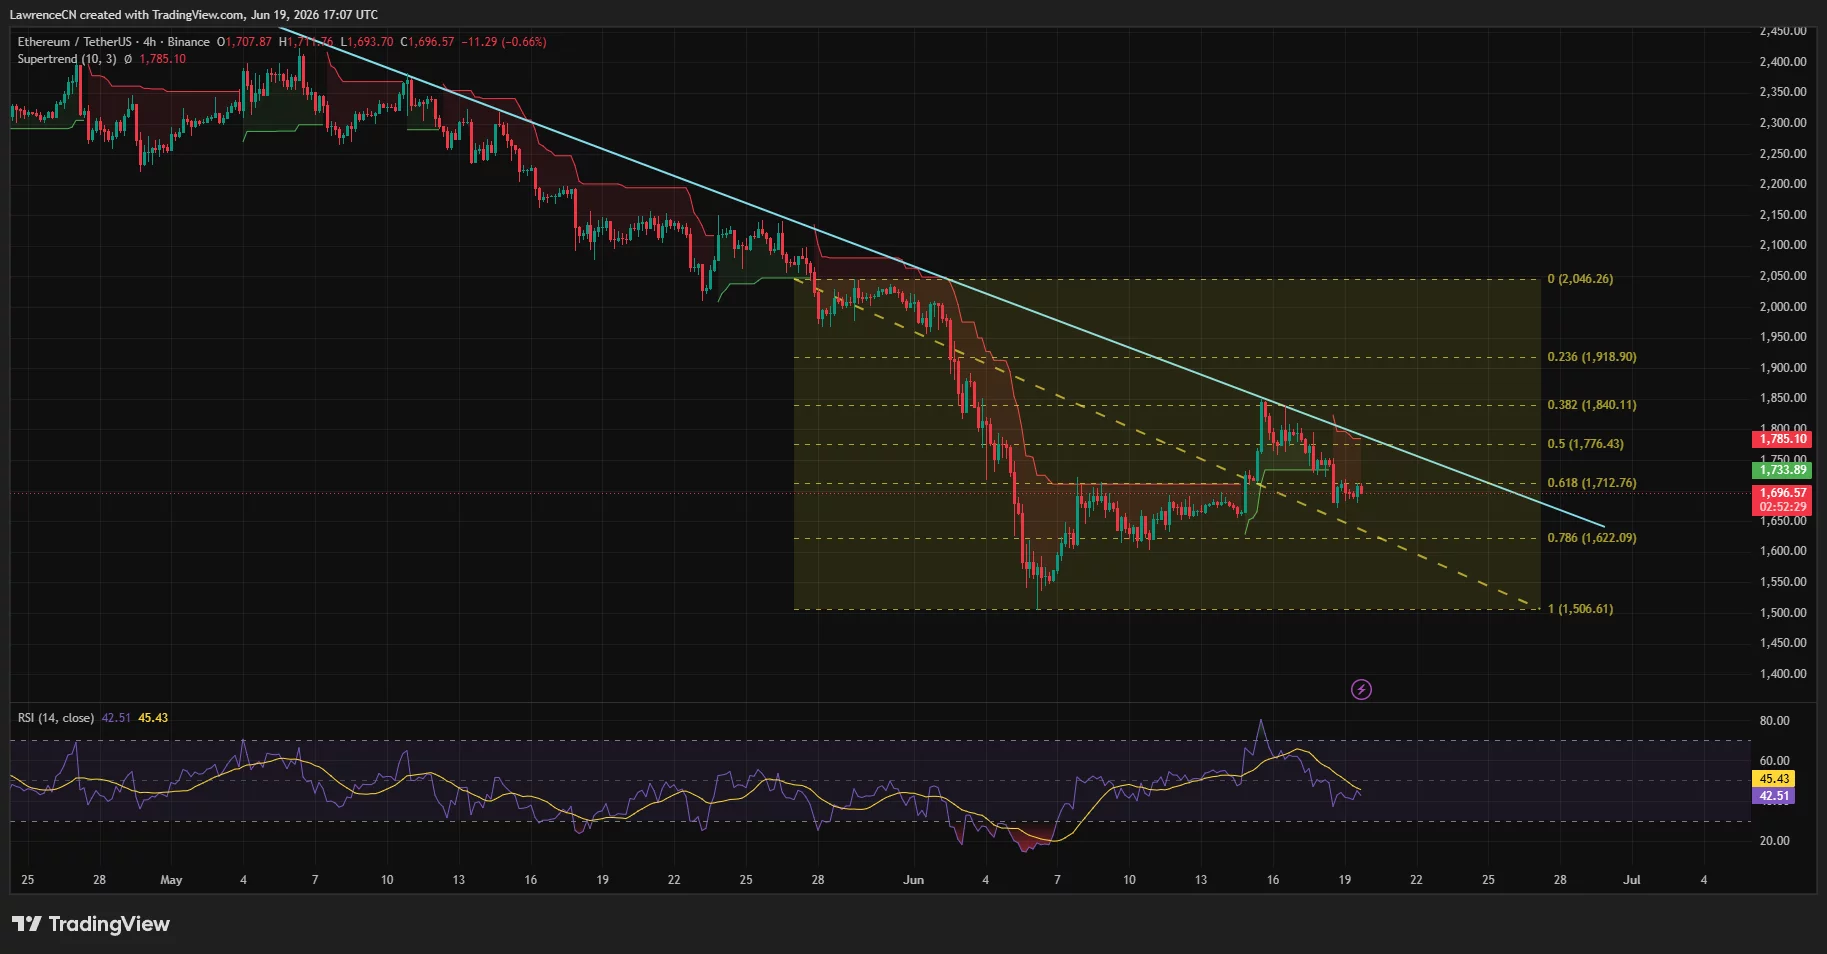
Ethereum 4-hour price chart — June 19 | Source:
crypto.newsA move above resistance near $1,780 and the large liquidity pocket around $1,800 could expose higher targets near $1,856. Failure to defend support around $1,700, however, could place renewed focus on the $1,620 area and eventually the June low near $1,507.
Disclosure: This article does not represent investment advice. The content and materials featured on this page are for educational purposes only.
Read more: John Boozman reveals why CLARITY Act faces Senate resistance