Traders scrolling through their charts this morning got a surprise they were not expecting. Billions Network price prediction chatter is suddenly everywhere, and it is not hard to see why. So
Traders scrolling through their charts this morning got a surprise they were not expecting. Billions Network price prediction chatter is suddenly everywhere, and it is not hard to see why. Somewhere between yesterday's close and today's open, a token that had been quietly drifting lower for weeks decided to move.
But what actually pushed BILL out of its slump? And is this the start of something bigger, or just another quick spike that fades by tomorrow?
What Is Really Driving Today's Sudden BILL Coin Rally
Billions Network price prediction talk started trending the moment traders noticed the token jump sharply in a single day. That kind of move tends to pull in both curious newcomers and existing holders who had been waiting on the sidelines.
We pulled up the chart expecting the usual small bounce. Instead, we found a coin that had broken clean out of a pattern it had been stuck inside for almost a month.
Basically, the price action tells a story of buyers stepping back in after a long quiet stretch. And that raises a bigger question: is this a fresh conviction or just short-term excitement?
There is also a broader angle here. Billions Network has been building around the idea of identity and trust for AI agents, a theme that has picked up real attention lately alongside otherAI agent narrative tokens as more investors talk about autonomous systems handling payments and decisions on their own.
So while the price chart is doing the talking today, the story behind the token is what keeps people watching it beyond just one green candle.
Billions Network Coin Snapshot: Key Numbers Traders Are Watching Right Now
MetricValueCoin NameBillions NetworkTicker SymbolBILLBlockchainEthereum Layer-2Today High$0.06607Today Low$0.0509RSI Level60.58Token TypeERC-20, UtilityToken CategoryArtificial Intelligence, Identity & Trust InfrastructureMarket Cap$149.36M24H Trading Volume$305M+24H Trading Volume Change+23.82%Circulating Supply2.42B BILL24H Change+20.32%
Source: Data by CoinMarketCap
Where Billions Network Came From And Why It Exists
Billions Network runs as an ERC-20 token built on an Ethereum layer-2 network, aimed at giving both humans and AI agents a verifiable identity and trust layer. The project pitches itself as infrastructure for a future where autonomous AI agents need permission, authority, and traceability before making financial moves on someone's behalf.
BILL Price History And How It Reached This Point
Billions Network has had a rough couple of months on the chart. The all-time high sits at $0.2328, hit back in mid-May 2026, and the token has been sliding well below that peak ever since.
The all-time low of $0.02079 came just weeks before that high, so the token's short life so far has already seen a wild swing from bottom to top.
Why Billions Network Is More Than Just A Trending Ticker
Community activity around Billions Network has picked up alongside the price. A recent post shared by a crypto commentator and reposted by the official Billions Network account framed the project as building the infrastructure that lets AI agents handle autonomous payments, with identity, authority, limits, and traceability as the core pillars.

Source: Posted on X by Laly Pump, reposted by Billions Network
The token also carries a CertiK rating of 4.2 stars, which gives it a layer of credibility beyond pure speculation. With over 39,000 holders and a fixed max supply of 10 billion tokens, the project has built out real distribution even while price action stayed weak for weeks.
Whale Concentration And Holder Data Worth Knowing Before You Trade
On-chain data shows a heavily concentrated holder base. The top 5 wallets alone control close to 83% of the market cap, and the single largest holder owns just over 33% of total supply.
That kind of concentration is not unusual for a newer token, but it does mean large wallet moves can swing price fast in either direction, a risk that echoes thewhale concentration risk seen in other small-cap tokens this year. Whale wallets make up under 4% of holders yet control nearly all of the market cap, according to on-chain analytics.
BILL Technical Chart Analysis
Source: Charting by TradingView
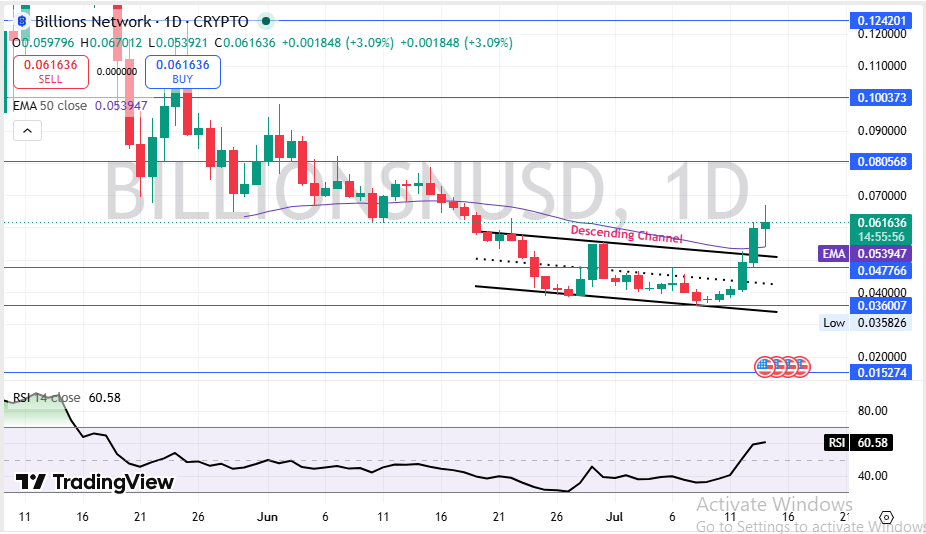
Price is now trading above the 50 EMA at $0.053947 on the 1-day chart, which had acted as resistance for weeks. RSI at 60.58 shows momentum without being stretched into overbought territory yet, and traders checking the broaderFear and Greed Index will find sentiment nowhere near extreme levels either.
Immediate support sits at $0.047766, and a clean break above $0.080568 would open the door toward $0.100373.
Where BILL Price Could Head Over The Next Few Weeks
Short-term direction depends heavily on whether buyers can defend the breakout zone. A hold above $0.055 to $0.060 keeps the bullish case alive toward the recent high.
TimeframeBearish TargetBase TargetBullish TargetKey Trigger24 Hours$0.058$0.062$0.067Volume staying above $200M3–7 Days$0.052$0.065$0.075Daily close above the 50 EMA2–4 Weeks$0.045$0.070$0.0805Break and hold above the first resistance level
Watch how price behaves around $0.060; that level decides the next few days.
What the Long-Term Chart Says About BILL Price Direction
Longer term, BILL still trades far below its all-time high, so any sustained recovery would need more than just one volume-driven day.
TimeframeBearish TargetBase TargetBullish TargetCatalyst Needed3 Months$0.035$0.080$0.120Sustained AI agent adoption news6 Months$0.030$0.100$0.150Exchange listing expansionEnd of Year$0.025$0.120$0.200Broader AI token sector rally2027 Outlook$0.020$0.150$0.250Real-world enterprise integration
The long-term case is not weak, but it is not proven either. It depends on Billions Network turning its identity and trust pitch into actual usage, not just chart momentum.
Three Ways The BILL Price Story Could Play Out From Here
Worst Case: Price fails to hold $0.047766 and slides back toward the invalidation zone near $0.036. This happens if volume dries up fast after today's spike.
Base Case:BILL consolidates between $0.055 and $0.075 for a few weeks while the market decides if this breakout has legs. Most likely path given current volume trends.
Best Case: A confirmed breakout above $0.080568 with rising volume pushes price toward $0.100373 and beyond. Needs continued buyer interest plus some fresh project news.
ScenarioPrice RangeWhat Triggers ItWorst Case$0.030 – $0.045Breakdown below support with fading trading volumeBase Case$0.055 – $0.075Range-bound consolidation following the breakoutBest Case$0.090 – $0.130Volume-backed breakout above key resistance levelsSupport, Resistance, And The Level That Breaks This Setup
Resistance zone:$0.080568 first, then $0.100373. A confirmed close above the first level with strong volume opens the path higher.
Support zone:$0.047766 is immediate support. Losing this weakens the breakout story fast.
Invalidation zone:$0.036007. A close below this level would flip the entire setup bearish and signal the breakout failed.
Analyst Take: What The Chart Is Really Telling Traders Today
The chart setup right now favors buyers, but only just. Price broke a descending channel on strong volume, and that is not nothing.
RSI at 60.58 gives room to run before hitting overbought territory. A weekly close above the 50 EMA would confirm buyers are serious, not just reacting to a one-day spike.
One thing to track beyond the chart: whale wallet behavior. With over 80% of supply sitting in a handful of hands, any large sell could undo today's move quickly.
The single most important level right now is $0.047766. Hold it, and the bullish case stays alive. Lose it and this rally starts looking like a trap.
That's the setup as it stands.
DISCLAIMER: This article is for educational purposes only and does not constitute financial advice. Crypto markets are volatile. Consult your investment advisor before making any investment decision.