Fears over the recent Binance hack are growing, and traders are now looking ahead to the Midterm Elections 2026. Crypto markets extended their October losses on Friday. Bitcoin (BTC), Ethereu
Fears over the recent Binance hack are growing, and traders are now looking ahead to the Midterm Elections 2026. Crypto markets extended their October losses on Friday.
Bitcoin (BTC), Ethereum (ETH) and XRP all face fresh selling pressure. Investor sentiment keeps sliding.
Binance Hack Worries Drag Crypto Market Cap Down 2.92% to $2.60T
The total crypto market cap fell 2.92% to $2.60 trillion. The sell-off comes just days before the U.S. vote on Nov. 3.
Bitcoin is moving toward $76,000. Ether trades under $2,300, and XRP dropped to $1.25.
All three are close to key support levels.
Fear Gauge Plunges to 30 From 51 in a Single Day
The Fear and Greed Index hit a new low of 30, which is in the Fear zone. A day ago, it read 51.
Period
Index Reading
Mood
Now
30
Fear
Yesterday
51
Neutral
Last week
50
Neutral
Last month
71
Greed
A month ago, traders were in Greed mode. The shift has been sharp.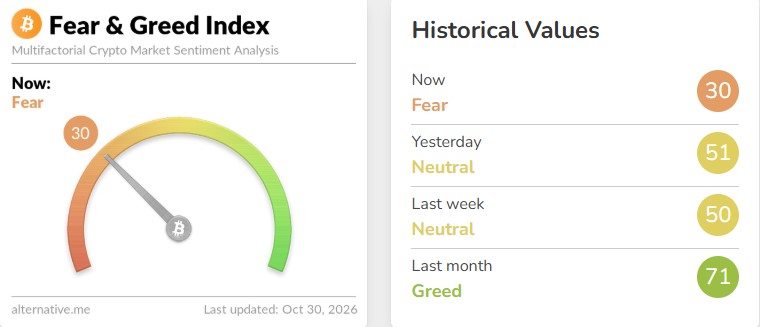
$1.59 Billion in Bets Wiped Out as Binance Sees Biggest Share
CoinGlass data shows about $1.59 billion in liquidations over 24 hours. Long positions lost $1.33 billion, or 83.9%. Shorts lost $255.79 million.
In total, 243,411 traders were liquidated. Binance held the largest exchange share at 49.1%.
The biggest single order was $11.09 million, a long on Binance's BTCUSDT pair.
Asset
24h Liquidations
Long Share
Bitcoin (BTC)
$529.01M
82.2%
Ethereum (ETH)
$363.54M
84.4%
Other coins
$182.96M
89.9%
Solana (SOL)
$83.31M
Not shown
XRP
$39.21M
Not shown
Most of the pain hit traders betting on a rise. That points to strong downside pressure.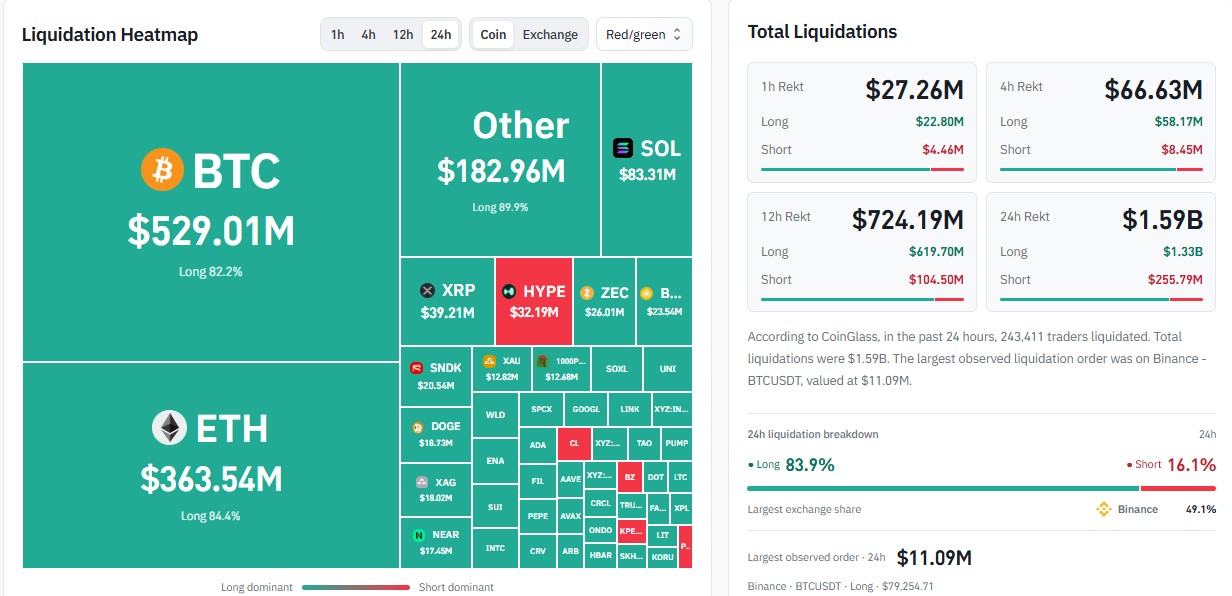
Traders Turn to Midterm Votes as Crypto Rules Hang in Balance
The U.S. midterms are on Tuesday, Nov. 3. All 435 House seats are up for election. So are 35 Senate seats, made up of 33 regular races and two special elections.
Midterm Elections 2026 matter to crypto because Congress writes the laws for digital assets. It also shapes market rules.
If lawmakers back crypto, talk of clearer rules could heat up. That may bring in more institutions and lift confidence.
But politics can also slow bills down. Rule uncertainty would then stay, and that could keep money on the sidelines.
ETFs Send Mixed Signals: Bitcoin and XRP In, Ether Out $105M
On Oct. 29 (ET), spot Bitcoin ETFs took in $17.07 million. It was the fourth straight day of inflows.
The XRP ETF added $8.43 million. Ethereum ETFs saw $105 million in outflows, also the fourth day in a row.
Fund
Net Flow (Oct. 29)
Streak
Spot Bitcoin ETFs
+$17.07M
4th day of inflows
XRP ETF
+$8.43M
Not stated
Ethereum ETFs
-$105M
4th day of outflows
Bitcoin Must Defend $76.4K to Avoid Deeper Slide
The 200-day EMA at $76.4K is the line to watch. It also lines up with old channel support.
RSI is near oversold levels. That can help a short-term bounce, but it is no guarantee.
Scenario
Trigger
Possible Zone
Bullish
Holds $76.4K
$80.5K to $81K, then $83K to $84K
Bearish
Loses $76.4K
$74K to $72K
With the Midterm Elections 2026 close, the news flow could test this level fast.
Ether Faces $2,000 Test if Sellers Stay in Control
If ETH stays below $2,385 while exchange balances stay high, $2,000 is the downside level to watch. A bounce there could draw buyers, but that is not certain.
A move back above $2,391 would ease some pressure. The next hurdle is $2,480.19.
XRP Cracks a Key Fibonacci Floor, Bears Eye $1.14
On the daily chart, XRP sits in a descending channel with lower highs and lower lows. Price is below the 20-, 50-, 100-, and 200-day EMAs.
It slipped under the 0.618 Fibonacci level at $1.2588. The daily low was $1.2002, and RSI is near 37, which signals weak momentum.
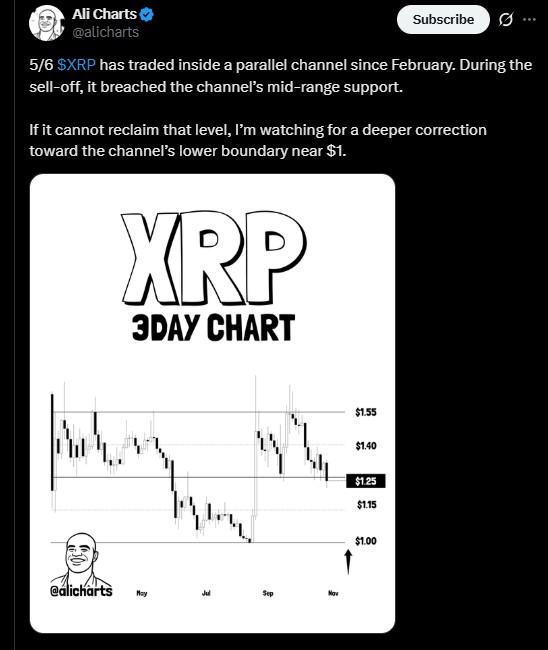
Analyst Ali Charts says XRP has moved in a parallel channel since February and lost its mid-range support. If it cannot win that back, he is watching the lower edge near $1.
Level
Price
What It Means
Resistance
$1.4273
Fibonacci 0.382
Resistance
$1.30 to $1.33
Key zone to clear
Resistance
$1.2588
Fibonacci 0.618, lost on the break
Current price
$1.2535
Daily close area
Support
$1.20 to $1.18
First support zone
Support
$1.1389
Fibonacci 0.786
Support
$1.00
Channel low in Ali Charts view
What Traders Are Watching Next
Hack headlines, whale moves, and ETF flows can change the mood fast. Traders may want to track all three in the days ahead.
Add the vote on Nov. 3, and Midterm Elections 2026 could keep volatility high. Nobody knows which way prices go from here.
Disclaimer
This article is for information only and is not financial advice. Crypto is volatile and carries a high risk of loss. Price levels are based on technical analysis and can fail. Do your own research and speak with a licensed financial advisor before you invest.