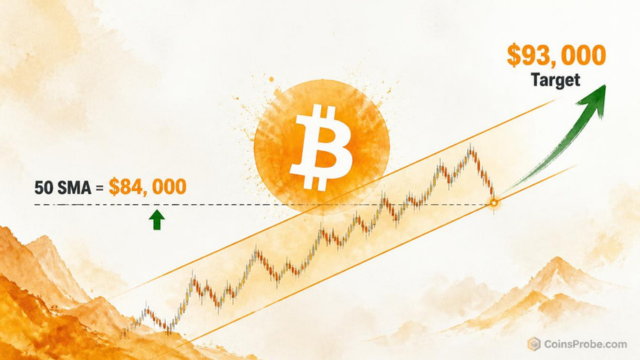
Key Highlights Bitcoin trades at $83,995 — just $5 below the 50 SMA at $84,000, the level analyst @alicharts says unlocks the next rally A 4-hour close above $84,000 mirrors the confirmed bou
Key Highlights
Bitcoin trades at $83,995 — just $5 below the 50 SMA at $84,000, the level analyst @alicharts says unlocks the next rally
A 4-hour close above $84,000 mirrors the confirmed bounce from the prior lower channel boundary — target: $93,000
The 200 SMA is holding beneath price, replicating the exact structural setup that preceded the last channel rally
Whale accumulation at the dip flagged by @alicharts on October 12 adds on-chain confirmation to the chart setup
Bitcoin is trading at $83,995 — up 0.33% in the past 24 hours, with a market cap of $1.688 trillion. The price sits at the lower boundary of an ascending parallel channel on the 4-hour chart, and one level now stands between the current consolidation and the next directional move: $84,000.
That level is where the 50 SMA currently sits on the 4-hour timeframe. Analyst Ali Martinez (@alicharts) identifies it as the line that unlocks the next rally — writing on October 13, 2026: “Last time $BTC bounced from the bottom of this channel, the 200 SMA held, and a 4-hour close above the 50 SMA confirmed the rally. Now, we’re dealing with a very similar setup. The key level to watch is $84,000.”
The 4-hour chart shared by @alicharts reveals Bitcoin trading inside a well-defined ascending parallel channel, with price currently pressing against the lower channel boundary near $83,763 — a zone circled by the analyst as a high-attention setup. The chart prints explicit levels at $70,000, $75,000, $80,000, $83,763 (current price), $86,000, $90,000, and $94,000. The upper channel boundary — where resistance is flagged with a downward arrow — sits near $94,000.
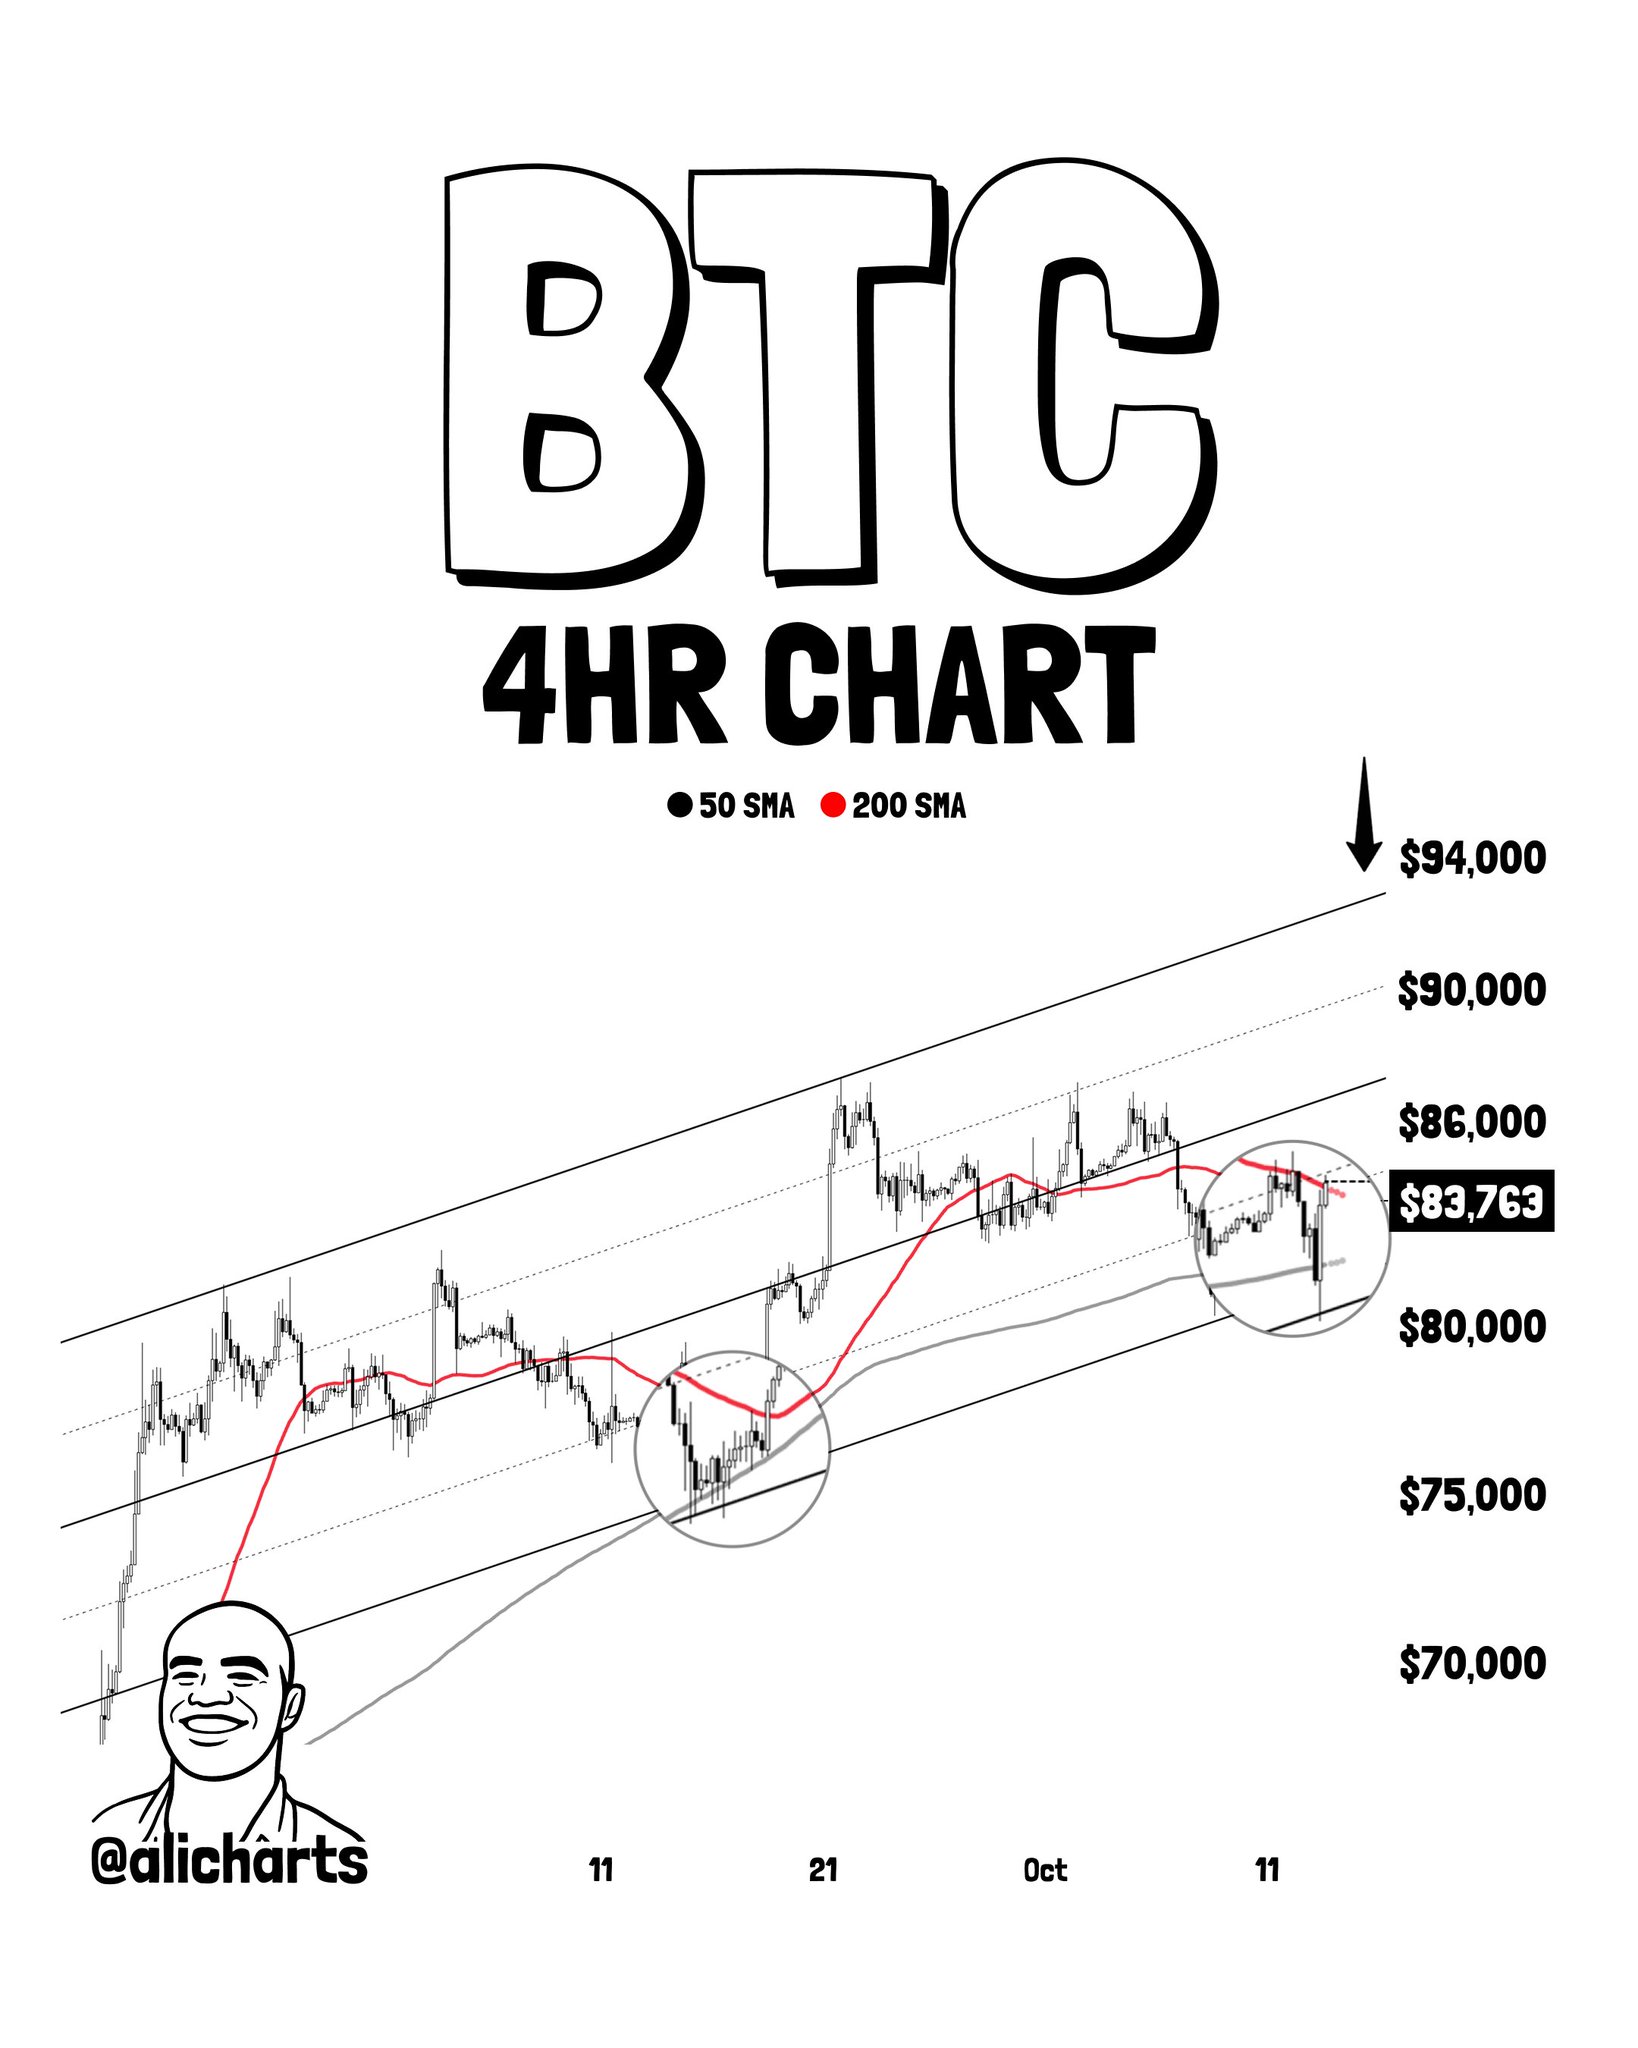
BTC 4HR Chart Analysis | Source: @alicharts (X)
Two prior bounces from the lower channel boundary are circled on the chart. In both instances, the 200 SMA (red, curving upward through mid-channel) provided the structural floor while the 50 SMA (tracking closer to price) acted as the confirmation trigger. The current setup mirrors both those circled zones precisely — Bitcoin is at the lower boundary, the 200 SMA is holding beneath, and the 50 SMA at $84,000 is the confirmation gate.
Martinez’s call is mechanically specific: not an intraday touch of $84,000, and not a daily close. A 4-hour candle closing above the 50 SMA at $84,000 is the trigger. That specificity matters. In the prior channel bounce he references, the same sequence played out — 200 SMA held as support, then a 4-hour close above the 50 SMA confirmed momentum and the rally followed. His stated target for the next leg higher is $93,000.
Separately, Martinez’s own thread from October 12, 2026 — cited within this post — flagged whale accumulation at the dip, titling it “BITCOIN WHALES BOUGHT THE DIP.” The combination of on-chain whale behavior at the lower channel boundary and the approaching 50 SMA reclaim is what frames this as a structurally similar setup rather than a generic chart pattern repeat.
For additional context on the broader on-chain picture, on-chain data has been building a bullish case for Bitcoin’s next major attempt — and the CryptoQuant analyst consensus currently rates BTC 82.5% bullish.
The 50 SMA on a 4-hour chart represents the average closing price over the last 50 four-hour candles — approximately 8.3 days of price action. It is a momentum reference, not a static price wall. When price is below it, the short-term trend is bearish by definition. A close above it signals that buyers have absorbed enough supply to shift 4-hour momentum back to the upside.
The 200 SMA on the same timeframe covers approximately 33 days of price action. It is the structural trend baseline. Martinez’s observation is that in the prior bounce, the 200 SMA did not break — it provided the floor that stopped the decline before the 50 SMA reclaim triggered the move. The same structure is currently intact: the 200 SMA is curving upward beneath price, and the 50 SMA sits just $5 above the current spot price.
This is also consistent with the broader multi-asset setup flagged recently — Bitcoin, Ethereum, and XRP simultaneously printed TD Sequential buy signals on 4-hour charts, adding a second independent signal layer to Bitcoin’s current position.
Bullish Scenario — 4-Hour Close Above $84,000
A 4-hour candle closing above $84,000 (the 50 SMA) replicates the confirmed bounce sequence from the prior channel low. Martinez’s stated target for the next leg is $93,000 — the mid-to-upper channel range visible on the chart, representing approximately 10.7% upside from the $84,000 trigger level.
Bearish Scenario — Failure to Reclaim $84,000
If Bitcoin fails to produce a 4-hour close above $84,000 and breaks below the lower channel boundary instead, the ascending channel structure is invalidated. The chart prints explicit support levels at $80,000 and $75,000 as the next visible structure below. No specific lower target was stated by the analyst — the invalidation is the channel break itself.
Bitcoin at $83,995 is $5 below the level that, according to Martinez’s analysis, separates consolidation from the next rally leg. The 200 SMA is holding. Whales accumulated at the dip. The channel structure is intact. What remains unconfirmed is the one trigger that transforms setup into signal: a 4-hour close at or above $84,000. Until that close prints, the setup is present but unresolved. When it does — or doesn’t — the chart gives a clean answer.
Watch $84,000 on the 4-hour close. A sustained close above it opens the path toward $93,000. A rejection here and channel break below shifts the structure bearish, with $80,000 as the next meaningful level on the chart.
Disclaimer: The views and analysis presented in this article are for informational purposes only and reflect the author’s perspective, not financial advice. Technical patterns and indicators discussed are subject to market volatility and may or may not yield anticipated results. Investors are advised to exercise caution, conduct independent research, and make decisions aligned with their individual risk tolerance.
Also Read: Ethereum Investor Price: The On-Chain Floor That Has Never Failed ETH