Key Highlights Bitcoin is trading at $62,663.85, down 28.39% YTD, while testing the lower boundary of a weekly Falling Wedge with a bullish RSI divergence signaling weakening downside momentu
Key Highlights
- Bitcoin is trading at $62,663.85, down 28.39% YTD, while testing the lower boundary of a weekly Falling Wedge with a bullish RSI divergence signaling weakening downside momentum.
- TOTAL2 is approaching a key descending trendline, with analyst @ZAYKCharts projecting a potential 40% altcoin rally if a breakout occurs.
- Both setups resemble the 2023 market bottom, when similar patterns preceded Bitcoin's recovery and a strong altcoin rotation.
- Ethereum is trading at $1,788.53, down 39.72% YTD, highlighting the broader altcoin weakness that makes the TOTAL2 breakout attempt especially important.
The cryptocurrency market remains in a decline phase after reaching all-time highs in October 2025. Geopolitical tensions, persistent inflation concerns, and the natural rhythm of market cycles have triggered a sharp downside across major assets.
Bitcoin (BTC) is currently trading at $62,663.85, down 28.39% year-to-date, with a market capitalization of approximately $1.25 trillion. Ethereum (ETH) is performing even weaker, sitting at $1,788.53, down 39.72% YTD, and holding a market cap of around $215.84 billion. Both assets are well below their all-time highs of $126,198 for BTC and $4,953 for ETH.
 BTC and ETH Prices on 14 July 2026/Source: Coinmarketcap
Bitcoin Weekly Structure: Testing the Lower Boundary of a Falling Wedge
The weekly Bitcoin chart shows a clear multi-month Falling Wedge — a pattern defined by two downward-sloping converging trendlines where price makes lower highs and lower lows, but with the lower highs declining faster than the lower lows, producing the characteristic wedge shape.
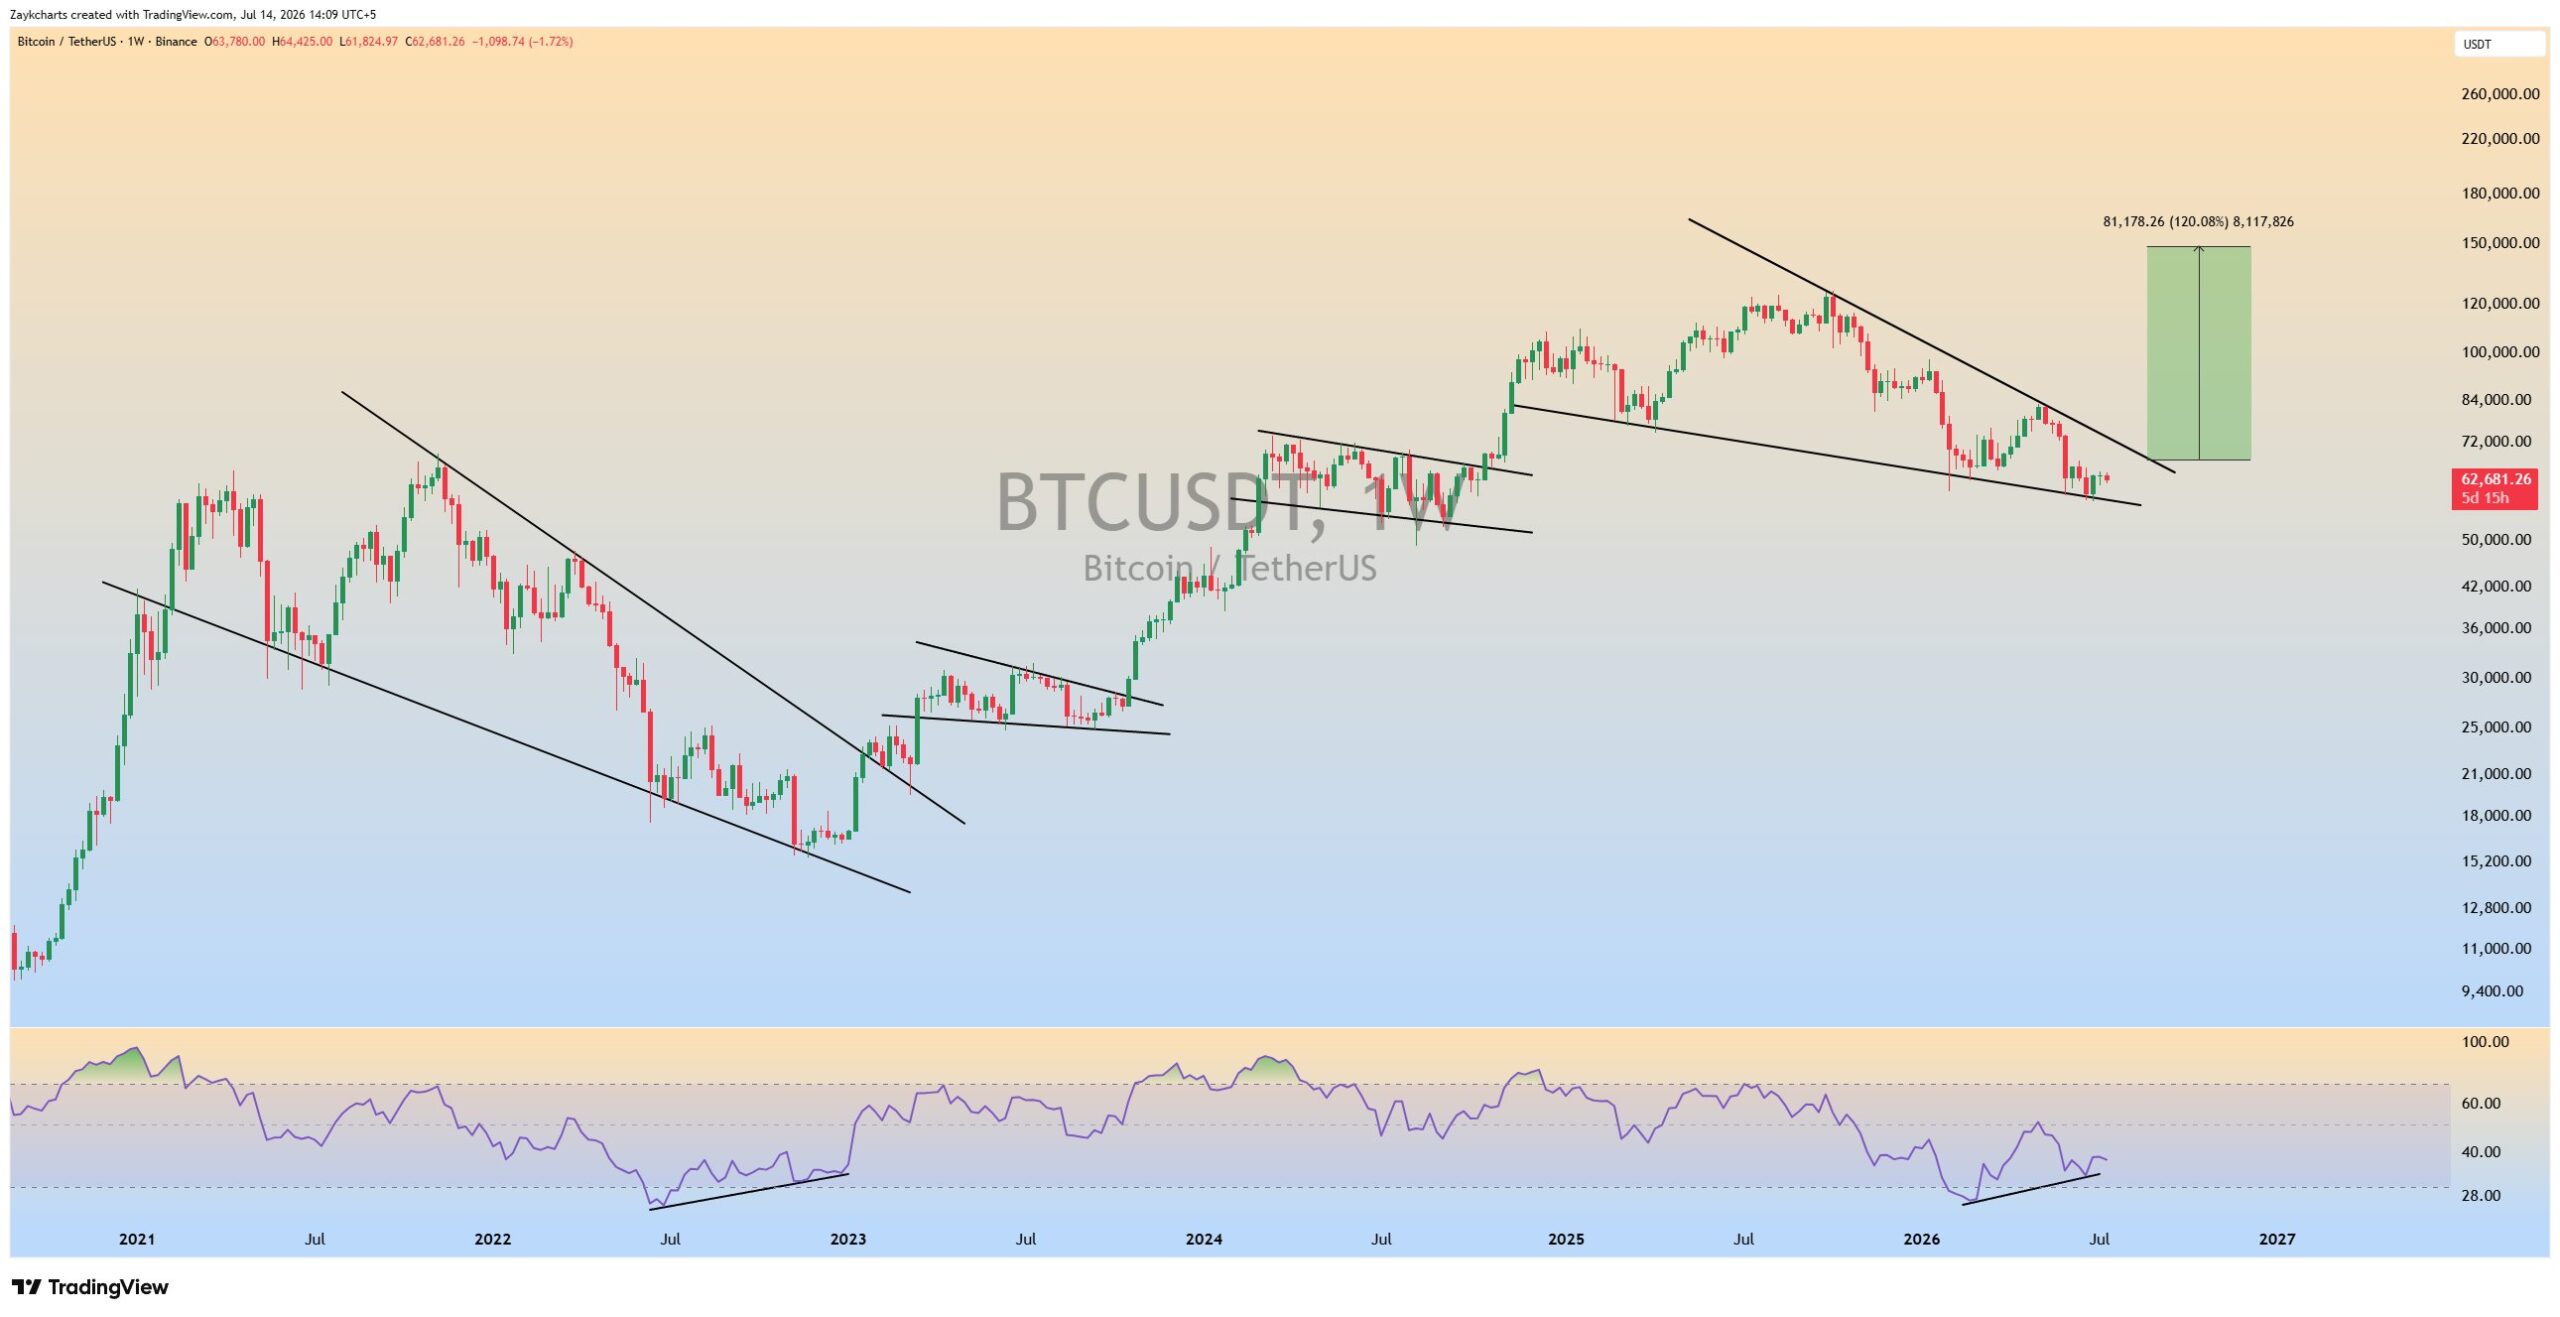 BTC/USDT Weekly Chart | Source: TradingView, @ZAYKCharts, July 14, 2026
Bitcoin is currently testing the lower boundary of this wedge — the critical support trendline that has been defining the floor of the current corrective structure. @ZAYKCharts noted:
“$BTC is currently testing the lower boundary of a multi-month Falling Wedge. RSI is showing a bullish divergence, hinting that downside momentum may be weakening. Watching how price reacts at this critical support zone.”
The RSI divergence adds weight to the setup:
A bullish RSI divergence occurs when price makes a new low while the RSI indicator makes a higher low — meaning momentum is weakening even as price continues declining. This divergence does not guarantee a reversal, but it is one of the most reliable early signals that selling pressure is exhausting itself before a structural shift.
The 2023 parallel:
The weekly chart includes a direct comparison to the 2023 Bitcoin consolidation structure. In that period — which preceded Bitcoin’s historic recovery from the sub-$20K cycle low — Bitcoin formed a comparable falling wedge pattern with a similar RSI divergence dynamic. The pattern resolved with a breakout that launched the recovery phase toward the current cycle’s $126,198 all-time high.
The structural similarity between the 2023 setup and the current weekly chart is the primary reason this setup is attracting significant analytical attention — it follows a documented historical precedent rather than being a novel or untested pattern.
What a successful defence means:
A hold of the current lower wedge boundary — particularly with sustained weekly closes above the support trendline — would provide the first meaningful technical signal that the current corrective phase is approaching completion. The initial recovery target would be the upper trendline of the wedge, which currently sits in the mid-to-high $70K range — representing the first structural resistance Bitcoin would need to clear on a recovery path to above $100K.
Altcoins: Approaching a Major Breakout Opportunity
The second chart tells the altcoin market’s version of the same story. TOTAL2 — which measures the total cryptocurrency market capitalisation excluding Bitcoin — is currently at $882.68 billion, pressing against a descending trendline that has acted as resistance since October 2025.
The chart shows that this trendline has been respected consistently across multiple test attempts — each time price approached it, sellers have re-emerged and pushed the altcoin market lower. The current approach is the latest, and potentially most significant, test of this resistance.
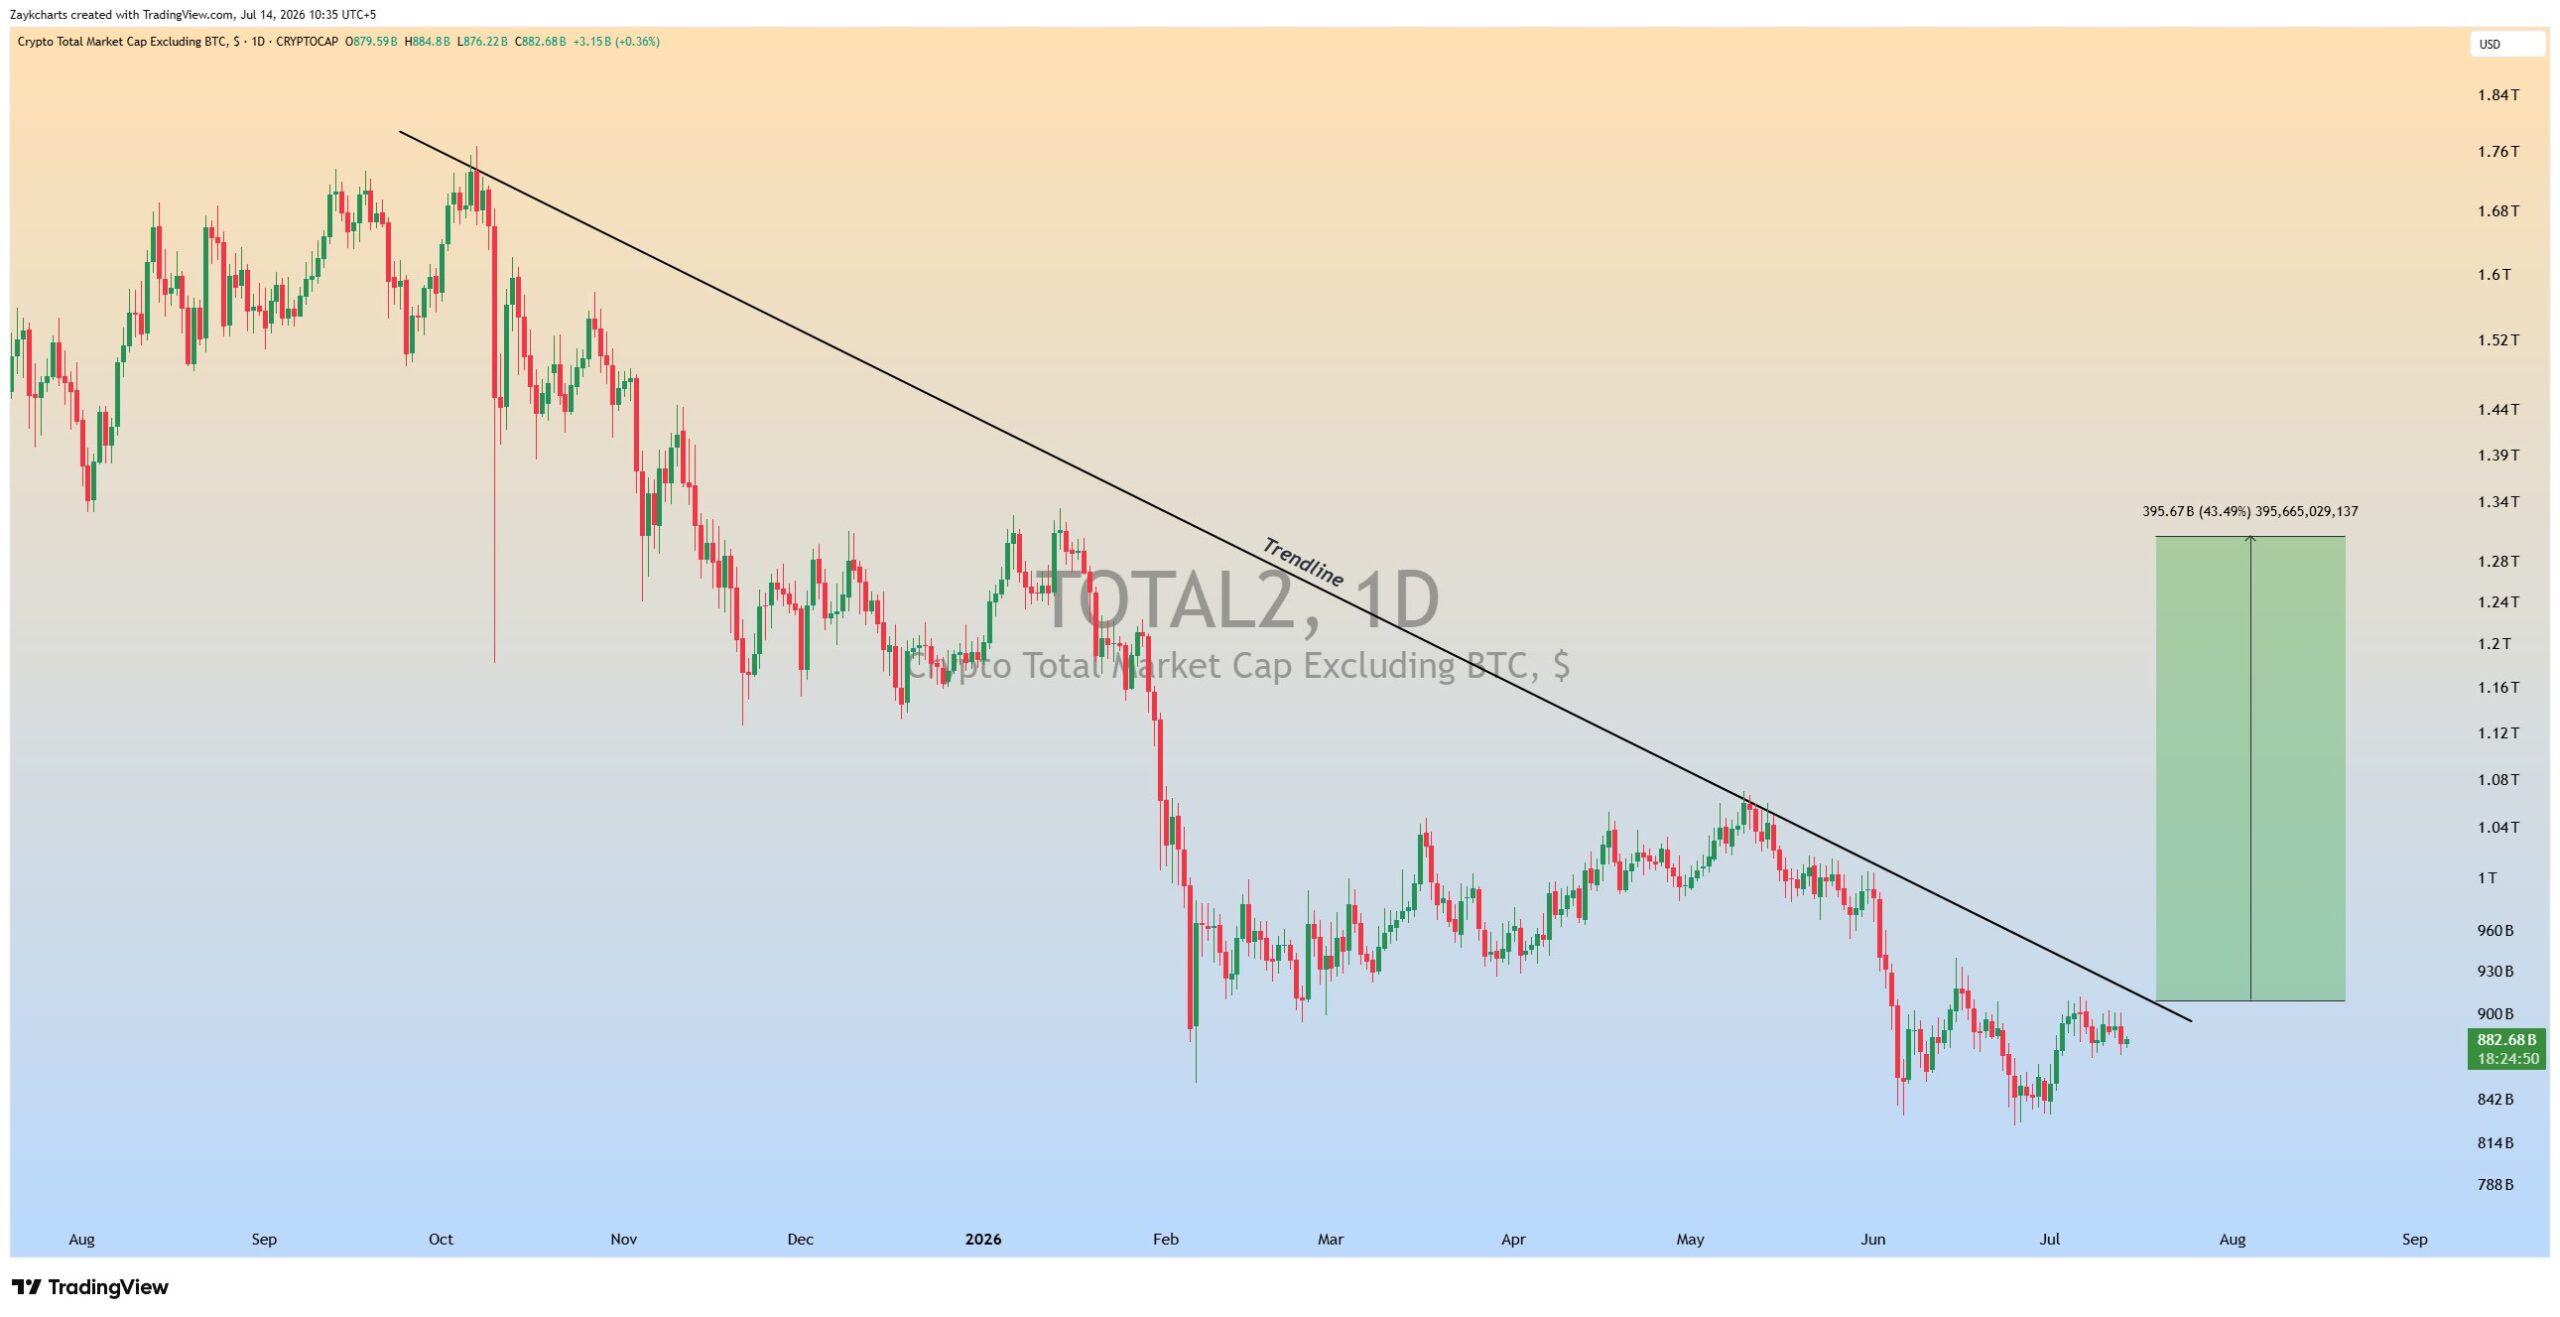 TOTAL2 Daily Chart | Source: TradingView, @ZAYKCharts, July 14, 2026
@ZAYKCharts highlighted:
“Altcoins are getting closer to a major breakout. $TOTAL2 has been respecting this descending trendline for months, and price is now approaching the key resistance once again. A confirmed breakout could open the door for a 40%+ move in the altcoin market.”
The +40% measured move:
The green projection box visible on the right side of the TOTAL2 chart shows the analyst’s measured move target — approximately +43.49% or $395.67 billion — which would take TOTAL2 from the current ~$882 billion zone to approximately $1.28 trillion if the descending trendline breaks with conviction.
This is consistent with the broader context we have covered throughout 2026 — where the 5-year altcoin sell pressure extreme of $209 billion in net outflows and only 36 of the top 100 altcoins remaining profitable for holders has created exactly the kind of compressed, extended bearish structure that historically precedes significant reversals when it eventually breaks.
Why Both Charts Matter — The Interconnection
Bitcoin and TOTAL2 breaking their respective resistance and support levels simultaneously would not be two independent events — they would be two expressions of the same underlying market shift.
The sequence that would signal a genuine recovery:
Bitcoin successfully defends the falling wedge lower boundary — providing the psychological and technical stability that altcoins need as a foundation for their own recovery. This removes the fear that Bitcoin will continue declining and taking altcoin prices lower with it.
With Bitcoin stabilised, TOTAL2 breaks its descending trendline — triggering capital rotation from Bitcoin-dominated positioning into altcoins as risk appetite returns. This is the classic “alt season” setup that has followed prior Bitcoin stabilisation phases.
The two charts are essentially showing the same story from different angles — Bitcoin’s chart shows where the floor might be, TOTAL2’s chart shows where the ceiling needs to break for the recovery to broaden out across the full market.
The 2023 Historical Parallel — What It Means
The most important analytical context for both setups is the 2023 Bitcoin bottoming structure. In that period:
Bitcoin formed a comparable falling wedge on the weekly chart with RSI bullish divergence present. The wedge resolved with an upside breakout. The recovery from that pattern launched one of Bitcoin’s most sustained rallies — eventually reaching the $126,198 all-time high in the current cycle.
The structural similarity does not guarantee the same outcome in 2026. Different macro conditions, different positioning, and different catalyst environments mean that historical patterns provide context rather than certainty. But as we covered in our 45% of LTH supply in loss and accumulation signal and our Bitcoin MACD positive and Porkopolis Power Law generational entry article — the on-chain and valuation signals surrounding Bitcoin’s current price zone are independently consistent with a bottoming process, making the 2023 technical parallel more credible rather than less.
Notably, the 2023 fractal is not isolated to Bitcoin — as we covered in our SOL 2023 vs 2026 chart comparison article, Solana is showing a strikingly similar structural echo to its own 2023 bottoming pattern — suggesting the fractal may be playing out simultaneously across multiple major assets rather than in Bitcoin alone.
Bullish Scenario — Wedge Defence + TOTAL2 Breakout
Bitcoin holds the falling wedge lower boundary with sustained weekly closes above the support trendline. RSI divergence resolves into a momentum recovery — and if the wedge breakout follows the same trajectory mapped on the weekly chart, the measured move projects a path toward a new all-time high above $140,000 — consistent with the green projection box visible on the BTC weekly chart above, which targets the $140K+ zone as the full pattern completion level.
From the current lower wedge boundary, reaching that target would represent approximately +120% upside — consistent with the 81,178.26 point / +120.08% move labelled directly on the weekly chart.
Simultaneously, TOTAL2 breaks the descending trendline with conviction — activating the +40% measured move toward $1.28 trillion in total altcoin market cap. Capital rotates from Bitcoin-dominant positioning into altcoins as risk appetite returns, producing the kind of broad-based recovery that has characterised prior cycle inflection points. If this sequence plays out — Bitcoin breaking to a new ATH above $140K while TOTAL2 adds 40% — it would represent one of the most significant macro reversals the crypto market has seen since the 2023 bottom that preceded the current cycle.
Bearish Scenario — Wedge Breakdown
Bitcoin fails to hold the lower wedge boundary — breaking below the support trendline with a sustained weekly close. This invalidates the falling wedge bullish setup and risks a more significant extension of the downtrend. TOTAL2 subsequently fails to break its descending trendline, and the altcoin market continues its current period of compressed, range-bound weakness.
Bottom Line
Bitcoin and the broader altcoin market are coiling simultaneously at two of the most important technical levels of the current cycle. Bitcoin’s weekly falling wedge lower boundary — with RSI bullish divergence confirming weakening downside momentum — mirrors the 2023 bottoming structure that preceded the current cycle’s recovery. TOTAL2’s descending trendline test offers a +40% measured move if altcoins break through resistance while Bitcoin stabilises.
The market is not showing certainty — it is showing a setup that has historically been the kind of environment where recoveries begin. Whether it plays out requires specific technical confirmations: sustained Bitcoin closes above the wedge support, and a TOTAL2 break above the descending trendline with genuine volume and conviction.
The next few weekly closes will likely provide the clearest signal this market has offered in months about which direction the resolution goes.
Disclaimer: The views and analysis presented in this article are for informational purposes only and reflect the author’s perspective, not financial advice. Technical patterns and indicators discussed are subject to market volatility and may or may not yield anticipated results. Investors are advised to exercise caution, conduct independent research, and make decisions aligned with their individual risk tolerance.
Read Also: Why Is Derive (DRV) Surging Today? Major Dual Listing Fuels Bullish Move.