Bitcoin’s current market structure presents a fascinating contradiction: price is recovering, momentum indicators are turning bullish, yet two independent layers of on-chain data—valuation st
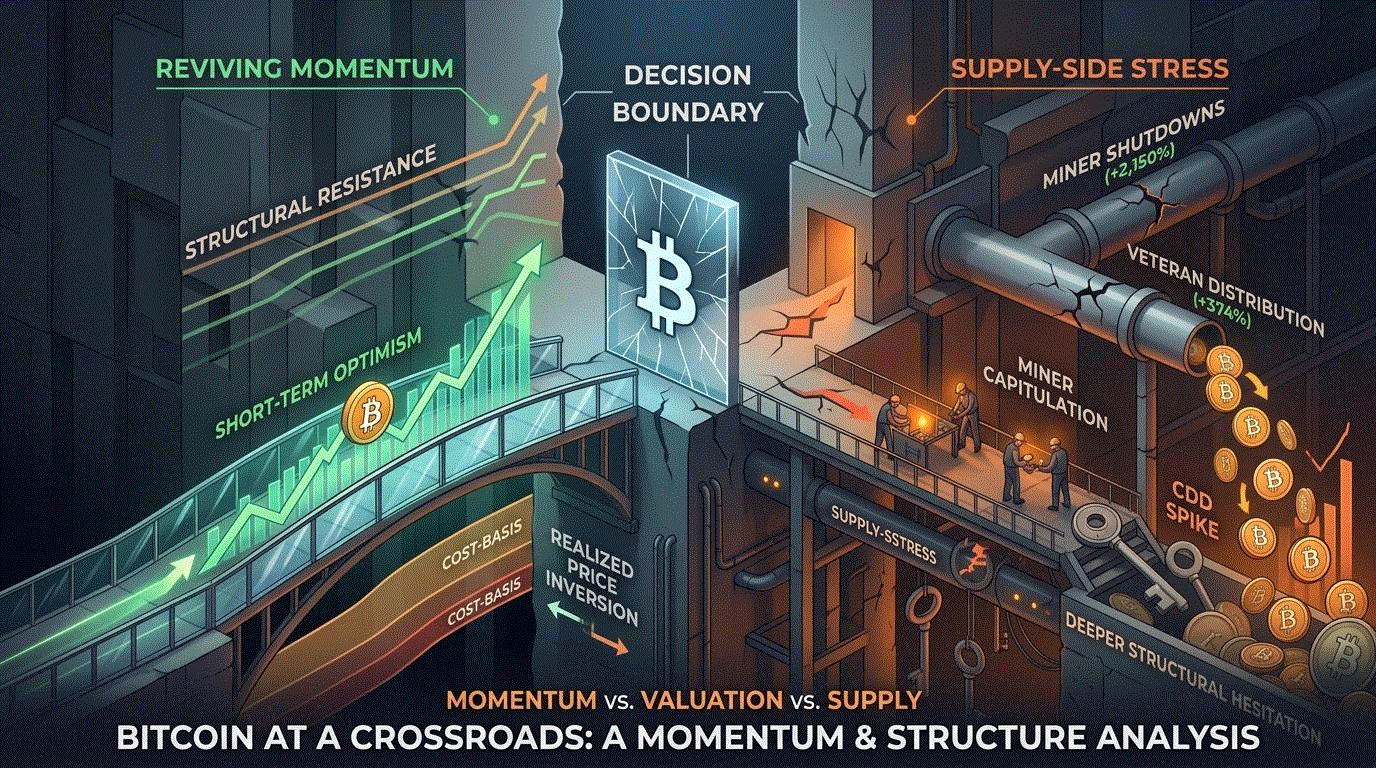
Bitcoin’s current market structure presents a fascinating contradiction: price is recovering, momentum indicators are turning bullish, yet two independent layers of on-chain data—valuation structure and supply-side behavior—suggest the rally is standing on shakier ground than the headline price action implies. Combining CryptoOnchain’s ensemble modeling with its supply-side research on CryptoQuant reveals a market caught between short-term optimism and deeper structural hesitation.
CryptoOnchain’s 7-signal ensemble model (v1) currently reads “Moderate Bull,” registering 4 of 7 bullish votes. The primary drivers are a firming MACD and rising Open Interest, up +0.74σ relative to recent norms. This has coincided with a genuine price recovery: BTC has climbed to $64,792, up 1.59% over the past seven days.
However, the picture changes materially once a single structural variable is introduced. Adding the Realized Price Age-Band Crossover metric (v2) flips the consensus to “Bear” at 4 of 8 votes, and recommended exposure drops sharply from 100% to just 30%. This single addition exposes how thin the bullish case currently is—momentum says one thing, valuation structure says another.
The disagreement is rooted in the Realized Price age-bands, which remain in a “Lean Bearish” posture, with 4 of 5 age-band pairs still inverted. The most persistent divergence sits between the 1-month/3-month and 6-month/12-month cohorts, which has held a -26.3% spread since January. In practical terms, this means the cost basis of recent buyers has not yet reclaimed dominance over longer-term holders—a pattern historically associated with distribution phases rather than the early stages of a sustainable uptrend.

Figure 1 — The decision boundary: momentum indicators (Panels 1–2) lean bullish, but a single structural signal (Panel 3) flips the ensemble consensus from Bull (100% exposure) to Bear (30% exposure).
Historical Validation: Two Models, Two Philosophies
Backtesting highlights why this divergence matters. The momentum-driven v1 ensemble has historically produced higher returns, with a full-cycle CAGR of +60.5%, but at the cost of deeper drawdowns during structural downturns. The structural v2 (Realized Price) model, by contrast, prioritizes capital preservation, limiting max drawdown to roughly -40% compared to a Buy & Hold drawdown of -76% over the same period.
Walk-forward validation of the Realized Price model shows a full-cycle Sharpe ratio of 1.27, and in 2025 specifically, it delivered returns between +23% and +29% while Buy & Hold declined -34.6%. This track record is precisely why the current bearish tilt in v2 cannot be dismissed as noise—the structural signal has a strong history of correctly anticipating trend shifts that pure momentum models miss.
Layered on top of this valuation conflict is a second, independently significant development: a structural shift originating from the foundational supply side of the network.
Over the past week, metrics tracking miner shutdowns surged by an extraordinary 2,150% relative to the 90-day baseline. This operational stress has translated directly into on-chain supply pressure, with miner-to-Binance flows increasing by more than 470%—a clear signal that miners are liquidating reserves to cover tightening post-halving economics.
Simultaneously, CryptoOnchain’s data shows a marked awakening of ancient supply. Coins aged 7 to 10 years saw a 374% spike in movement, accompanied by a sharp rise in Coin Days Destroyed (CDD)—a metric that captures the economic weight of long-dormant coins re-entering circulation. This pattern strongly suggests that veteran holders from previous cycles are using the current 62k–64k range to distribute portions of their holdings, likely to secure liquidity amid ongoing macro uncertainty.

Figure 2 — Supply-side stress: persistent miner netflows signal capitulation (Panel 1), while a 374% spike in 7-to-10-year-old coin movement (Panel 2) confirms veteran distribution.
Organic Distribution, Not Panic
What separates this environment from a typical speculative sell-off is its character. This isn’t leveraged retail liquidation or short-term panic selling—it’s fundamental, organic distribution occurring simultaneously from two distinct cohorts: financially stressed miners and long-term holders securing gains.
Notably, the market’s absorption capacity has been impressive. Despite extreme miner offloading and a wave of ancient-coin movement—both classic precursors to sharp downside pressure—Bitcoin’s price has held a relatively stable range. This suggests underlying passive demand is quietly absorbing this foundational supply without breaking down.
Connecting the Dots
Taken together, these two data sets tell a coherent story:
- Momentum is real but fragile. The recovery to $64.8k reflects genuine short-term buying pressure, but it hasn’t yet been strong enough to pull the Realized Price age-bands out of inversion.
- Structural resistance remains intact. The recent-buyer cohort still lacks dominance over veteran holders on a cost-basis level—an unresolved condition historically tied to distribution rather than accumulation.
- Supply-side stress adds a second layer of caution. Miner capitulation and ancient-coin movement, while currently being absorbed well by the market, represent conditions that have historically preceded the final phases of post-halving consolidation.
Outlook
A market where reviving momentum tests unbroken structural resistance—while simultaneously absorbing elevated supply from miners and veteran holders—typically signals a low-conviction, transitional phase rather than the start of a decisive trend. The key variable to watch going forward is whether price strength can be sustained long enough to drag the Realized Price age-bands out of inversion, and whether passive demand can continue absorbing supply-side pressure without cracking.
Until that structural confirmation arrives, both the ensemble model divergence and the ongoing distribution pattern suggest that this recovery, while encouraging, remains a test of resistance rather than a confirmed breakout.