Doctor Profit identifies 60,000–64,000 as an accumulation zone, citing extreme fear and oversold market conditions. Bitcoin's daily RSI fell to 19, while estimated mining production costs rea
- Doctor Profit identifies 60,000–64,000 as an accumulation zone, citing extreme fear and oversold market conditions.
- Bitcoin's daily RSI fell to 19, while estimated mining production costs reached approximately $61,200.
- BTC trades near $64,718, with support at $64,000 and $62,000 as MACD shows a bullish crossover.
Bitcoin analyst Doctor Profit maintains a bullish outlook despite the latest market selloff, identifying 60,000–64,000 as an accumulation zone. He cites extreme market fear, oversold daily RSI readings, mining production costs and a major liquidation cluster. Meanwhile, Bitcoin traded at $64,718 on Binance's four-hour chart on November 16, 2026.
Doctor Profit Identifies Four Reasons for Bitcoin's Bottom
Doctor Profit noted that Bitcoin previously rallied from 60,000–64,000 to $87,000 after his July bullish call. He acknowledged that his recent $80,000 long trade failed to meet expectations.
However, he said the Fear and Greed Index has now fallen to 10, indicating extreme fear. He distinguishes long-term spot investing from short-term trading and targets a two-to-three-year holding period.
Additionally, Bitcoin's daily RSI recently reached approximately 19, while its weekly RSI stands near 43. Doctor Profit also identified a triple bottom on the daily RSI, which previously marked a local market bottom.
Mining Costs and Liquidations Support the60K–64K Target
Doctor Profit cited a recent Bitcoin production-cost estimate of approximately $61,200. He compared this figure with Glassnode's June 2022 estimate of $17,200. Bitcoin subsequently reached a bear-market low near $16,400.
He also identified a large liquidation cluster around $62,000 on the six-month chart. According to his analysis, aggressive weekend selling pushed Bitcoin from $68,000 toward $62,000.
Doctor Profit questioned why the seller chose a thinner weekend market instead of higher-volume weekdays. He suspects the liquidation cluster was the intended target, although this remains his interpretation.
Bitcoin Price Tests $64,000 as Indicators Improve
Bitcoin's four-hour chart shows lower highs and lower lows after falling from approximately $84,000 in October. BTC Selling intensified between November 10 and 15, breaking $72,000 and $68,000.
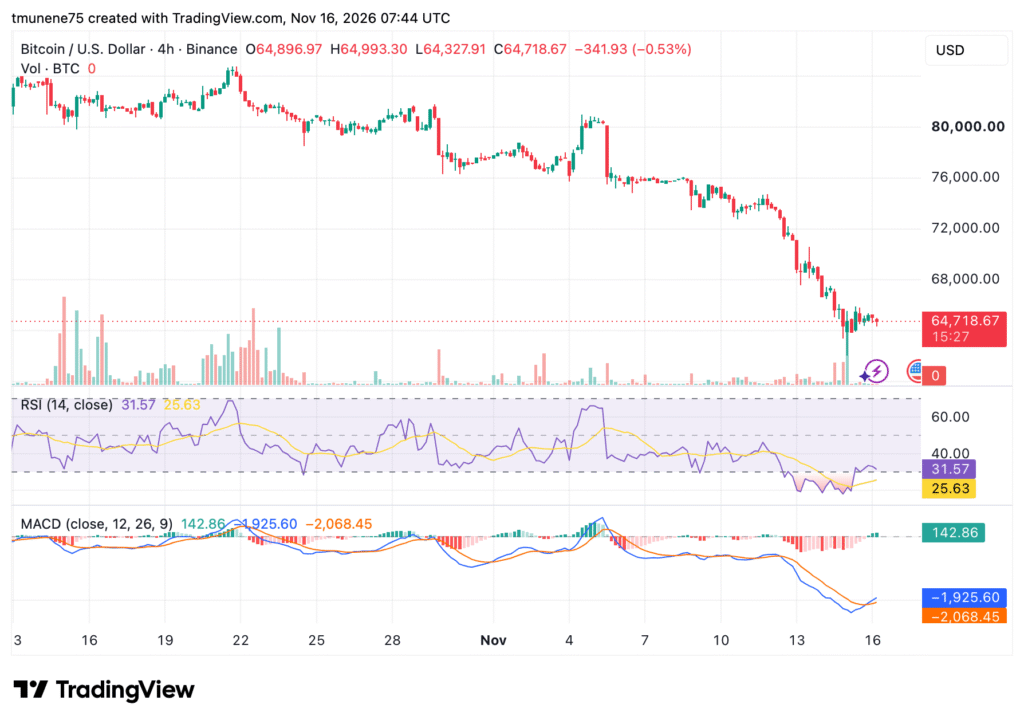
Source:
TradingView
The RSI is at 31.57, while MACD has crossed bullishly, with its histogram reaching 142.86. However, both MACD lines remain below zero.
Bitcoin faces support at $64,000, followed by $62,000 and $60,000. Resistance stands at $66,000, $68,000 and $72,000. Doctor Profit maintains his 60,000–64,000 accumulation target.