Key Highlights Bitcoin trades at $80,027 (-0.52%) after breaking below a 4-hour rising parallel channel per @alicharts $82,000 must hold as resistance for the correction to continue — a recla
Key Highlights
Bitcoin trades at $80,027 (-0.52%) after breaking below a 4-hour rising parallel channel per @alicharts
$82,000 must hold as resistance for the correction to continue — a reclaim invalidates the breakdown thesis
Ali Charts identifies $72,500 as his next buying opportunity — roughly 9.4% below current price
Spot Bitcoin ETFs recorded a $635.5M single-day outflow on Oct 22, with IBIT leading at -$110.3M (SoSoValue)
Bitcoin is trading at $80,027 — down 0.52% in the past 24 hours — after breaking below a rising parallel channel on the 4-hour chart. That structural breakdown, if confirmed with $82,000 holding as resistance, sets the stage for a continued correction toward $72,500: the level where one prominent analyst is already positioning to buy.
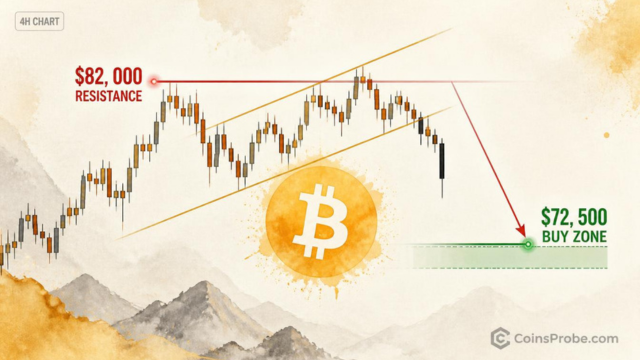
Analyst Ali Charts (@alicharts) flagged the breakdown on October 26, 2026, writing: “Bitcoin appears to have broken below a rising parallel channel on the 4-hour chart. As long as $82,000 holds as resistance, $BTC could continue correcting toward $72,500. That’s where I’ll be looking for the next buying opportunity.” The call is precise — not a range, not a zone. A single level where he intends to act.
A rising parallel channel on the 4-hour chart is a structure defined by two upward-sloping trendlines of equal gradient — one connecting swing lows, one connecting swing highs. When price breaks below the lower trendline with conviction, it signals that the sequence of higher lows sustaining the channel has been violated. The immediate implication: the market’s near-term bullish structure has broken down.
Ali Charts identifies $82,000 as the critical resistance level that must hold for the correction to continue. This is not a support-turned-resistance level in the classical sense — it is the structural significance of the broken channel’s lower boundary. A reclaim above $82,000 would invalidate the breakdown thesis and suggest the break was a false move. As long as that level caps any bounce, the corrective path toward $72,500 remains open.

BTC 4H Chart | Source: @alicharts (X)
Bitcoin is currently trading at $80,027 — already $1,973 below the $82,000 resistance threshold, meaning the resistance is already overhead, not ahead. The market has room to continue lower without first requiring a test of $82,000.
Ali Charts does not label $72,500 as a support level derived from a specific indicator. He identifies it as his next buying opportunity — a deliberate, pre-planned entry based on the measured move from the channel breakdown and prior structural context at that price area. The distance from current price ($80,027) to that level represents approximately 9.4% additional downside.
This framing matters. It separates a panic-driven sell target from a structured re-entry thesis. The analyst is not predicting capitulation — he is identifying a level where he believes risk/reward flips back in favor of bulls.
The channel breakdown does not exist in a vacuum. Spot Bitcoin ETF data via SoSoValue shows a $635.5M daily net outflow on the latest trading session (October 22), the heaviest single-day exit in recent sessions. IBIT alone recorded $110.3M in outflows, while FBTC shed another $31.8M. Total ETF net assets stand at $104.71B — still substantial, but the directional pressure from institutional redemptions is structurally consistent with the 4-hour chart’s message.
Over the past four trading sessions, the net ETF flow stands at +$442.7M (three inflow days, one outflow day), suggesting the trend is not a sustained institutional exit — but the magnitude of the single-day $635.5M outflow is notable context for why Bitcoin is struggling to hold structure above $80,000. For more on recent ETF redemption dynamics, see Bitcoin ETF Outflows Hit $137.9M on Oct 23 — Final Figure May Be Far Higher.
Two macro data releases arrive on October 28 that could define near-term direction: Core PCE Price Index (MoM and YoY) and GDP (QoQ). These are the Federal Reserve’s preferred inflation and growth gauges. Markets currently price a 90.6% probability of a rate hold at the October 28 FOMC meeting (3.75%–4.00% target rate), per SoSoValue. A hotter-than-expected Core PCE print could pressure risk assets further, potentially accelerating Bitcoin’s path toward Ali Charts’ $72,500 target. A soft print could provide a relief bounce — but that bounce would need to stay below $82,000 to keep the bearish channel breakdown thesis intact.
It is also worth noting that Bitcoin’s behavior around macro-political cycles has precedent. Bitcoin’s Midterm Election Curse — Four Cycles, Four Crashes documents the historical pattern of Bitcoin underperforming into mid-term electoral windows — a backdrop that arguably adds structural context to this correction. Meanwhile, levered positions have already begun unwinding: Two Hyperliquid Whales were liquidated as Bitcoin dropped below $80K, a sign that the move below this psychological threshold carries real forced-selling consequences.
Not all institutional actors are selling. Strategy (formerly MicroStrategy) added 267 BTC for $22.1M in its latest purchase, bringing total holdings to 848,517 BTC as of October 19. Over the past three weeks, Strategy acquired 851 BTC for $72.8M — a steady accumulation pace that reflects longer-term conviction regardless of near-term chart structure. This does not invalidate the 4-hour breakdown, but it does establish that at current price levels, at least one major institutional buyer remains active.
Bullish Scenario — Reclaim Above $82,000
A sustained 4-hour close above $82,000 would invalidate the channel breakdown thesis. It would suggest the lower trendline held as support on an intraday basis and that the break was a false move. In this scenario, the corrective setup toward $72,500 is off the table until price revisits and confirms the breakdown with a failed retest of $82,000 from below.
Bearish Scenario — $82,000 Caps and Correction Continues
If $82,000 continues to act as resistance on any bounce from current levels, Ali Charts’ base case plays out: Bitcoin continues lower toward $72,500, representing approximately 9.4% additional downside from the current $80,027 price. At that level, he has stated his intention to seek the next buying opportunity.
The 4-hour channel is broken. $82,000 is overhead resistance. Bitcoin at $80,027 is already 9.4% above the analyst’s stated buy zone. Two macro catalysts — Core PCE and GDP — arrive October 28 and will determine whether the correction accelerates or stalls. The level traders are watching: $82,000 to the upside as the invalidation point, and $72,500 to the downside as the structured re-entry.
Disclaimer: The views and analysis presented in this article are for informational purposes only and reflect the author’s perspective, not financial advice. Technical patterns and indicators discussed are subject to market volatility and may or may not yield the anticipated results. Investors are advised to exercise caution, conduct independent research, and make decisions aligned with their individual risk tolerance.