For three straight sessions the US spot bitcoin ETFs had been a one-way door. Then, on 4 November, the door swung back: the funds took in a net $74.6 million, the first positive print since 2

For three straight sessions the US spot bitcoin ETFs had been a one-way door. Then, on 4 November, the door swung back: the funds took in a net $74.6 million, the first positive print since 29 October, according to Farside Investors’ daily flow tracker.
The number is small next to what left before it. On 30 October the group bled $643.2 million, on 2 November another $398.6 million, and on 3 November $115.6 million. That is $1.16 billion across three trading sessions. A $74.6 million inflow recovers 6.4% of that. By 10:09 UTC on 5 November, bitcoin was quoted at $80,355, up 2.58% over 24 hours and 4.8% above the 30-day closing low of $76,709, per CoinGecko. Ether ran further: $2,415.56, up 4.09%.
Two data sets explain more about the session than the price does. The flow tape shows who was buying and who was leaving. The liquidation tape shows who was forced out.
Inside the $74.6 million: IBIT out, FBTC in
The headline total hides a split between the two funds that dominate the complex. BlackRock’s IBIT recorded a $201.2 million net outflow on 4 November while Fidelity’s FBTC pulled in $236.7 million, according to Farside’s fund-level table. That is $437.9 million moving in opposite directions between the two largest spot bitcoin funds on the same day.
The smaller funds leaned positive: Bitwise’s BITB added $15.2 million, ARKB $19.9 million, and Invesco’s BTCO $4.0 million. Grayscale’s GBTC and MSBT printed zero. FBTC’s inflow exceeded IBIT’s outflow by 17.6%, which is the entire net gain and then some.
That composition changes how the day should be read. A net inflow driven by one fund while the largest fund redeems is not the same signal as a broad return of allocators. It is a rotation inside the wrapper, and it landed on the same session the price began to recover.
Set 4 November beside 21 October, the last time the complex took in more than $500 million in a session, and the difference is stark. That day the group added $524.8 million, with IBIT contributing $235.0 million and FBTC $212.7 million. Two funds carried 85% of the total in the same direction. Wednesday’s print was 14.2% of that session in size, and its two largest funds pulled against each other. Scale and agreement have both weakened.
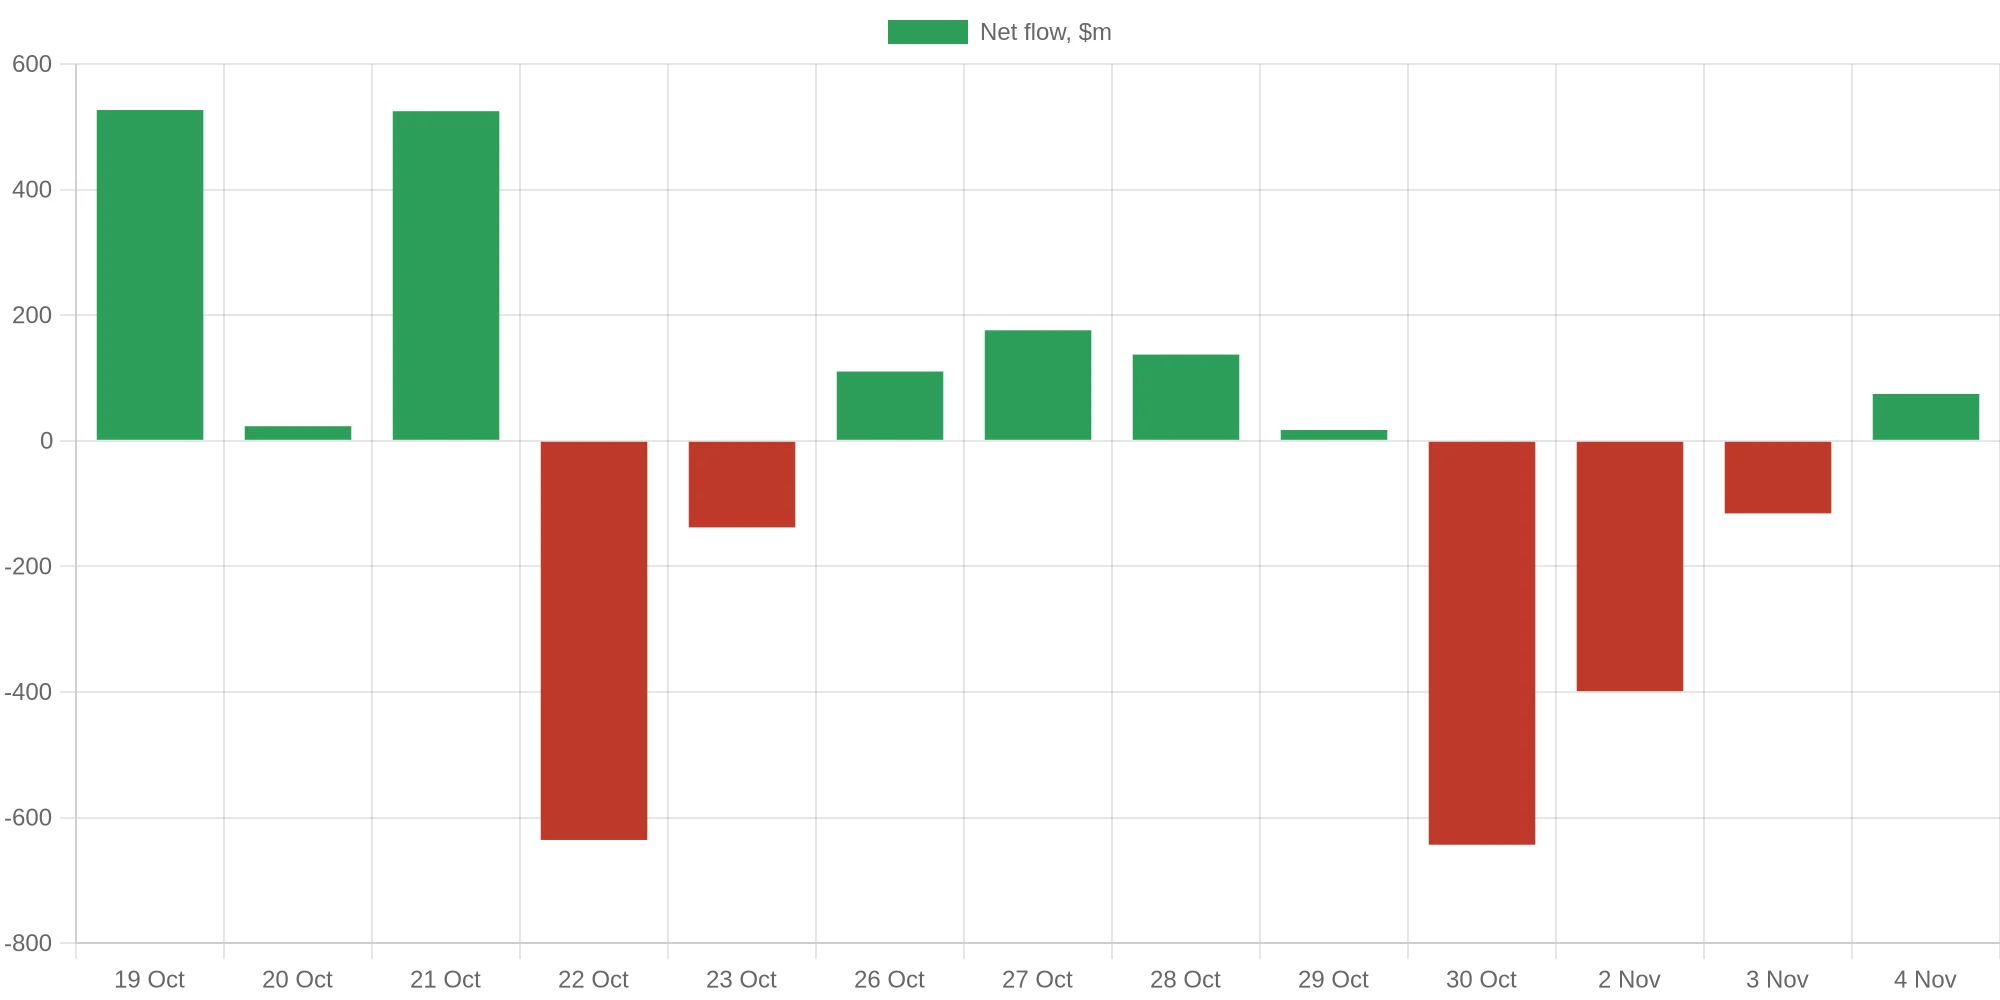
The four-session arithmetic is what matters for the week: −$643.2M, −$398.6M, −$115.6M, then +$74.6M leaves the group at a net −$1,082.8 million since 30 October. Tuesday’s article on the third consecutive outflow day described a market leaning on price alone. Wednesday’s print is the first evidence since then that the redemption queue thinned.
The $741 million day was two-thirds shorts
CoinGlass put 24-hour liquidations across crypto at $741.16 million by 07:55 UTC on 5 November, with shorts accounting for $493.58 million, or 66.6%, and longs $247.58 million. In BTC alone, $273.48 million was liquidated and 93.6% of it was short. Ether contributed $209.19 million, 60.2% of it short.
According to CoinGlass, in the past 24 hours, 101,410 traders liquidated. Total liquidations were $741.16M. The largest observed liquidation order was on HTX – ETH-USDT, valued at $38.00M.
That single order deserves precision, because it cuts against the day’s headline: the CoinGlass liquidation dashboard labels it a long at $2,429.33. The largest individual casualty was someone positioned for more upside on ether, not a trapped bear.
The ratio is the cleaner measure. At $493.58 million of shorts against $247.58 million of longs, forced short closes outnumbered forced long closes 1.99 to 1 over 24 hours, the inverse of a sell-off day, where the long side carries the losses. Shorts positioned for a continuation of the October slide met a market that refused to keep falling.
The window matters too. In the four hours to 07:55 UTC, liquidations totalled $17.78 million and 77.9% of that was long, with Hyperliquid’s $3.82 million running 99.2% long. The forced selling that flattered the 24-hour number happened earlier; the most recent four hours show fresh longs paying for entry near the highs. That is a market where positioning has already turned two-sided, and it is the detail a plain “short squeeze” recap misses. The mechanism, why forced short closes accelerate a rally, is set out in our explainer on what a short squeeze is and how it unwinds.
Ether’s week is stronger than its month
Ether’s 4.09% gain against bitcoin’s 2.58% is not a one-day curiosity. Over seven days ETH added 4.19% while BTC added 0.29%. Measured in bitcoin, ether climbed from 0.02890 BTC on 29 October to 0.03006 BTC, a 4.03% improvement in the ratio.
The month tells the opposite story. Thirty days ago the ratio stood at 0.03153, so ETH remains 4.65% weaker against BTC over that span, and 10.84% lower in dollars against bitcoin’s 6.54% decline. Ether is also 10.8% below its 30-day closing high of $2,697.17, set on 7 October; bitcoin sits 6.5% below its own, $85,540.
Two derived figures put the gap in perspective. Ether’s $295.16 billion market capitalisation equals 18.27% of bitcoin’s $1.6156 trillion. And if the ETH/BTC ratio merely retraced to its 30-day high of 0.03153 at bitcoin’s current $80,355, ether would change hands at $2,534, 4.9% above spot. That is arithmetic on the ratio, not a forecast, and the position it describes is a recovery inside a down month rather than a trend reversal.
What the 30-day range says about the next decision
Bitcoin’s closing prices over the past 30 sessions span $76,709 on 3 November to $85,540 on 7 October, an 11.5% band. At $80,355 the price sits 41.3% of the way up that band, closer to the floor than the ceiling despite the two-day bounce.
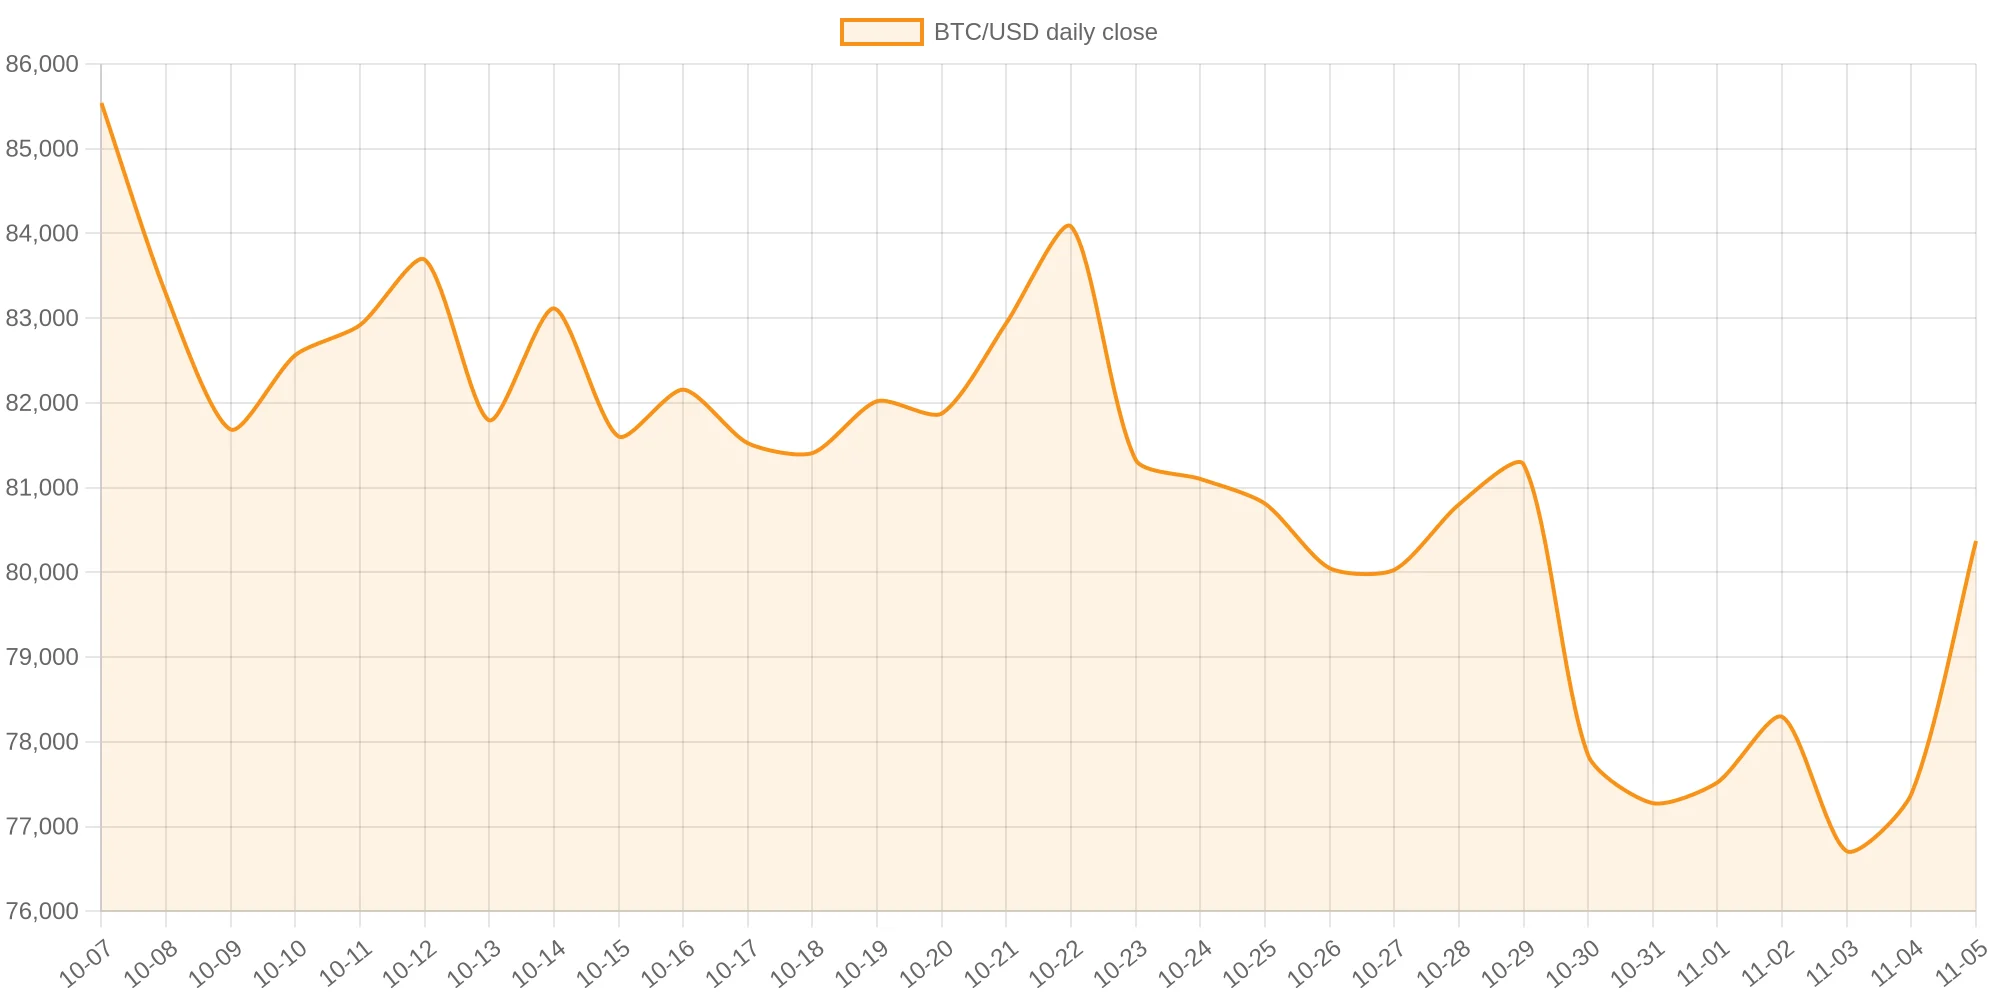
The levels drawn from that series are straightforward, and the method is worth stating: they are daily closes and 24-hour extremes from CoinGecko, and a level counts as broken on a daily close rather than an intraday wick. Resistance sits first at $81,004, the 24-hour high, then at the 8 October close of $83,282 and the 7 October close of $85,540. Support sits at $77,385, the 4 November close, and at $76,709, the 3 November close and the range floor. A daily close below $76,709 would void the reversal reading; a daily close above $81,004 would shift attention to $83,282. Nothing beyond the 30-day range is claimed here, because no data in this set supports a target outside it.
What a single flow print cannot establish
Three cautions belong in any account of this session. The first is timing: US spot ETF flow figures are tabulated after the fact and reflect creation and redemption activity tied to that session’s net asset value, so the 4 November inflow cannot be offered as an explanation for a price move on 5 November. The second is direction of causality: CoinGlass records forced closes that follow price, and the presence of $493.58 million of short liquidations proves that short positions were closed out by force, not that spot buying caused the rally. Available evidence does not establish which came first.
The third is scope. No funding-rate or open-interest series is cited in this article, which means the positioning reset described above is inference from liquidation composition rather than a measured unwind. Farside is explicit about its own limits: the tracker notes that its table is generated automatically and that it is not liable for errors or inaccuracies in the data. Exchange-reported liquidation figures also vary with each venue’s own reporting.
What would sharpen the read is a second consecutive inflow day and, specifically, IBIT’s return to positive territory. IBIT’s lifetime net intake of $65.6 billion is 116% of the industry’s cumulative $56.6 billion, because Grayscale’s GBTC has redeemed $28.0 billion over the same period. That concentration is why a $201.2 million IBIT outflow on 4 November carried more weight than the $74.6 million net figure suggests. If that fund keeps redeeming while FBTC absorbs the flow, the industry’s first inflow in four sessions is a rotation, not a return.
The next flow tabulation, covering 5 November, publishes on 6 November. Until then the market is trading on two facts (a small inflow and a large short flush) and one open question: whether the buyers who replaced the shorts stay after the forced orders are done.
Data: Farside Investors, CoinGlass, CoinGecko.