Bitcoin ETFs lost $185 million on November 13, extending their outflow streak to seven days, while Ethereum ETFs attracted $2.36 million. CryptoQuant reported negative 284,000 BTC in 30-day a
- Bitcoin ETFs lost $185 million on November 13, extending their outflow streak to seven days, while Ethereum ETFs attracted $2.36 million.
- CryptoQuant reported negative 284,000 BTC in 30-day apparent demand, its weakest reading since April 2025, despite whales accumulating 47,000 BTC.
- U.S. spot Bitcoin ETF flows reversed from positive 49,700 BTC to negative 29,600 BTC as short-term holders and mid-sized wallets continued selling.
Bitcoin spot ETFs recorded $185 million in net outflows on November 13, extending their withdrawal streak to seven trading days, according to SoSoValue. Ethereum funds, meanwhile, attracted $2.36 million in net inflows. CryptoQuant data showed broader Bitcoin demand weakening as whale purchases failed to offset selling from short-term holders, ETFs and mid-sized wallets.
Bitcoin ETF Outflows Extend to Seven Days
BlackRock’s IBIT accounted for $144 million of the latest Bitcoin ETF withdrawals. Fidelity’s FBTC followed with $41.92 million in net outflows. Ethereum spot ETFs moved in the opposite direction, recording $2.36 million in net inflows.
Fidelity’s FETH led Ethereum fund purchases with $11.64 million. However, Grayscale’s Ethereum Mini Trust ETF, trading under the ticker ETH, recorded $9.28 million in net outflows.
CryptoQuant Points to a Wider Demand Shortfall
CryptoQuant said Bitcoin had fallen 24%, while whale wallets added approximately 47,000 BTC. However, that buying represented only a fraction of the broader demand decline. Thirty-day apparent demand fell to negative 284,000 BTC, its weakest reading since April 2025.
https://twitter.com/cryptoquant_com/status/2121643220727934999?a=m5IvfMMchjNoXZk_Bzs&s=20
The firm also reported that U.S. spot ETF flows shifted from positive 49,700 BTC to negative 29,600 BTC. Strategy’s 30-day Bitcoin purchases remained relatively small. Meanwhile, short-term holders, ETFs and mid-sized wallets continued selling faster than whales could absorb.
ETF Flows Turn Uneven After Earlier Inflows
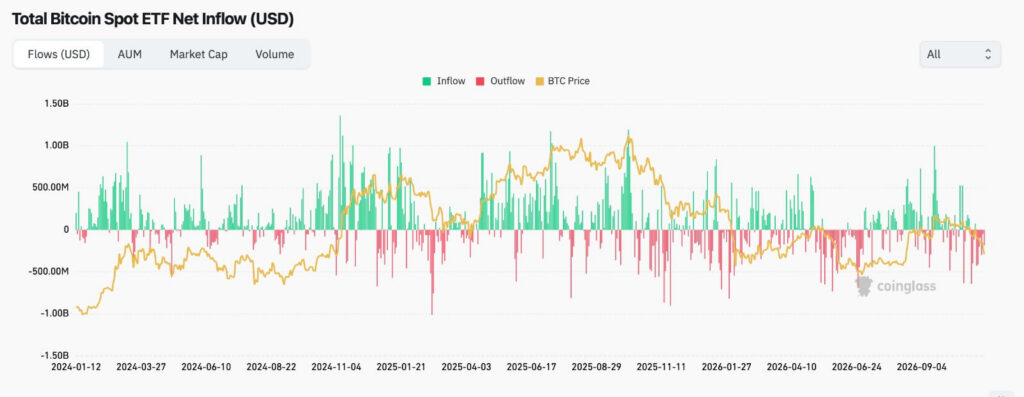
The historical chart shows mostly positive Bitcoin ETF flows during early 2024. Several daily inflows exceeded $500 million, while one approached $1 billion around March. Institutional demand strengthened toward November, with the largest visible inflow reaching approximately $1.35 billion.
Source:
Coinglass
Flows became more volatile in early 2025. An outflow near $1 billion appeared around March, before inflows recovered between April and September. Several later increases exceeded $500 million, with some topping $1 billion.
From November 2025 through November 2026, flows became inconsistent, alternating between withdrawals and large inflows. September 2026 recorded an inflow near $1 billion, but the increase did not persist.
The latest chart section shows renewed outflows alongside a declining Bitcoin price line. During the earlier recovery, Bitcoin’s price line also climbed toward the chart’s upper region.