Bitcoin climbed to $78,000 today, even as Trump lost Congress in the midterms. Bitcoin, Ethereum, XRP, and BNB each gained more than 2%. Total market cap rose 1.98% to $2.62 trillion in 24 ho
Bitcoin climbed to $78,000 today, even as Trump lost Congress in the midterms. Bitcoin, Ethereum, XRP, and BNB each gained more than 2%.
Total market cap rose 1.98% to $2.62 trillion in 24 hours. Zcash, Pump, LayerZero, Venice Token, SPX6900, and Lighter were among the top gainers.
That is a surprise. Democrats won both the House and the Senate, and many expected a selloff.
Trump Loses Congress, but Crypto Refuses to Fall
President Trump pushed several crypto bills, including the GENIUS Act and the CLARITY Act. With Democrats in control of Congress, the CLARITY Act is unlikely to pass.
Bitcoin, Ethereum, XRP prices are holding up. The result was largely priced in. Analysts, polls, and prediction markets all pointed to a Democratic win.
Why Some Traders Are Not Mourning Trump's Crypto Agenda
Some analysts say Trump has not been good for the industry. He launched the Trump meme coin, and Melania Trump launched the Melania token. Both jumped at first, then crashed, and most holders lost billions.
Trump also launched World Liberty Financial and its WLFI token. Its main product is the USD1 stablecoin, which the UAE used to fund its Binance investment.
The SEC under Trump dropped most of its cases against Coinbase, Uniswap, Tron, and Ripple Labs. That looked like a win. But the retreat may have made the industry less safe for investors.
So a Democratic Congress could put the brakes on Trump's moves. It could also make crypto safer.
Fear Still Rules, and Shorts Are Getting Burned
The Fear and Greed Index sits at 34, which is Fear. It was 26 yesterday, 51 last week, and 70 last month.
Sentiment has weakened over the month, with a small bounce since yesterday.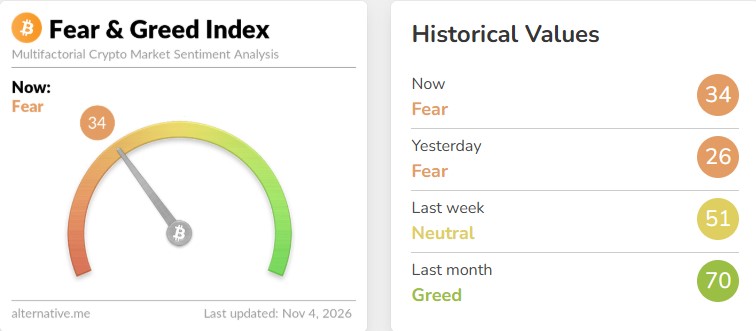
Liquidations tell a similar story. In the last hour, $32.67 million was wiped out. Shorts took $31.36 million of that, and longs lost $1.30 million.
Over 24 hours, total liquidations hit $463.49 million. Longs lost $269.65 million, and shorts lost $193.83 million.
Bitcoin saw the most at $169.80 million. Ethereum followed with $78.81 million.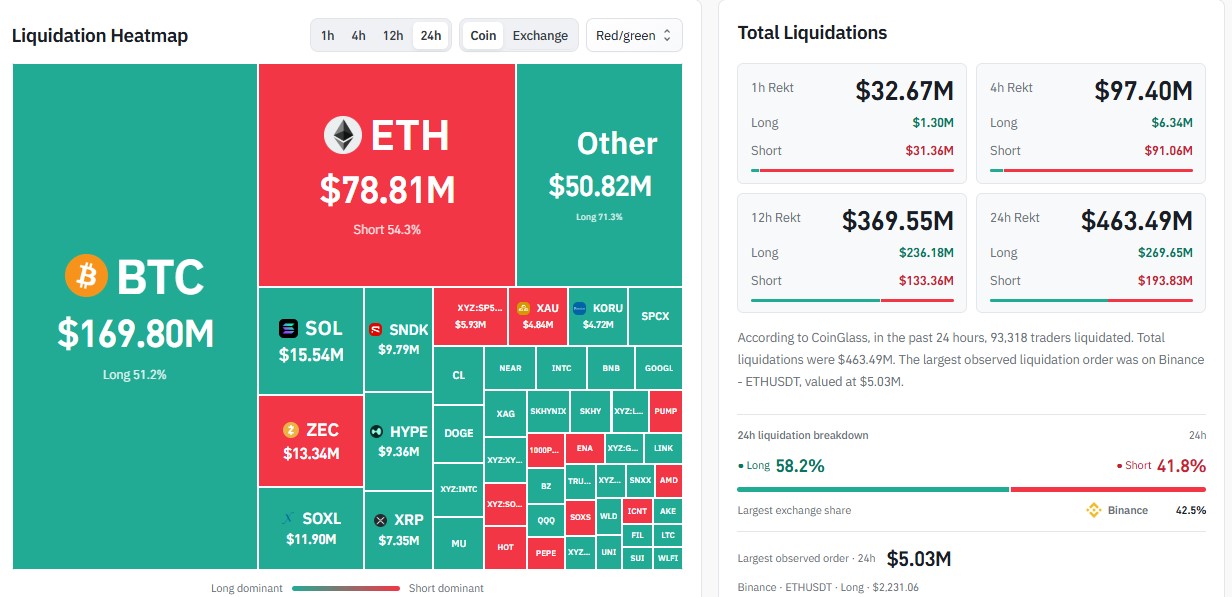
Bitcoin Eyes $79,000 as Bulls Defend $76,500
Bitcoin is trading near $78,000 to $78,200.
Level
Why It Matters
$79,000
A reclaim would strengthen the relief signal
$78,000 to $78,200
Current trading zone
$76,500 to $77,000
Area bulls want to defend
$76,000
A clean break would suggest fear is being confirmed
$75,875
Short-term holder realized price
$75,500
Recent low
If BTC holds $76,500 to $77,000, the odds of a relief bounce improve. A move back above $79,000 would add weight to that view.
A clean break below $76,000 would suggest the fear is right. Then $75,875 and the $75,500 low come into focus.
Crowded longs add some risk either way. BTC could stay choppy for a while.
Ethereum Falling Wedge Hints at Rebound Toward $2,500
On the daily chart, Ethereum is forming a falling wedge. This pattern can signal a bullish turn if price breaks the upper trendline.
The trend is still weak. ETH trades below the 20, 50, 100, and 200 EMAs. RSI is near 40, which shows soft momentum but is close to oversold.
Analyst Ali Charts noted that ETH fell 22.64%, from $2,806 to a low of $2,171. The TD Sequential then flashed a buy signal on the 3-day chart.
He sees a rebound to $2,500 as possible. Above that, the $2,700 trendline comes into focus.
Level
Price Zone
What It Means
Support 1
$2,220 to $2,250
Immediate floor near the wedge base
Support 2
$2,150 to $2,100
Next area if $2,220 breaks
Resistance 1
$2,350
First recovery target
Resistance 2
$2,405 to $2,450
Next hurdle for buyers
Breakout Zone
$2,500 to $2,600
Needs a strong daily close above the wedge
Trendline
Near $2,700
Larger resistance if $2,500 breaks
If $2,220 to $2,250 holds, ETH could try $2,350. After that, $2,405 to $2,450 is the next test.
A strong daily close above the wedge, backed by rising volume, could open the way to $2,500 to $2,600. If ETH drops below $2,220, the slide may continue toward $2,150 and $2,100.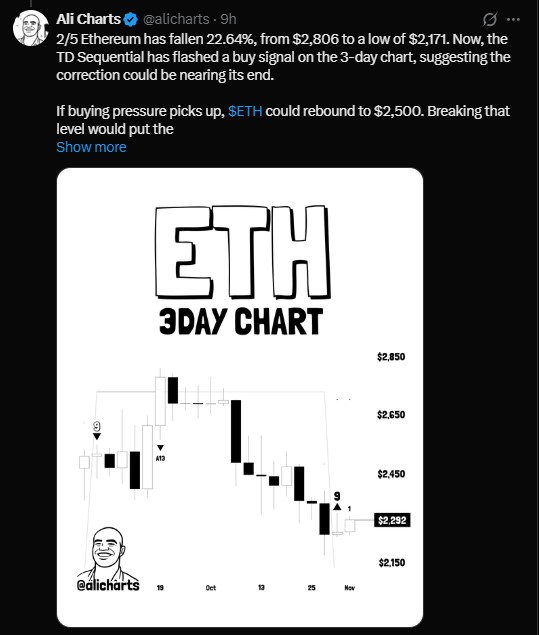
XRP Squeeze Sparks Breakout Talk, but $1.32 Is the Test
Analyst Ali Charts says XRP just logged its tightest Bollinger Band squeeze since August on the 4-hour chart. Price has now pushed above the upper band.
The last time the bands were this tight, the coin rallied about 71% in three days. That is a past result, not a promise.
The daily chart is calmer. Price has moved lower inside a descending channel since late September.
XRP sits near the lower Bollinger Band at $1.2294. The middle band is at $1.2943, and the upper band is at $1.3592. RSI is 42.68, above its signal line at 39.89, which points to weak momentum with small signs of recovery.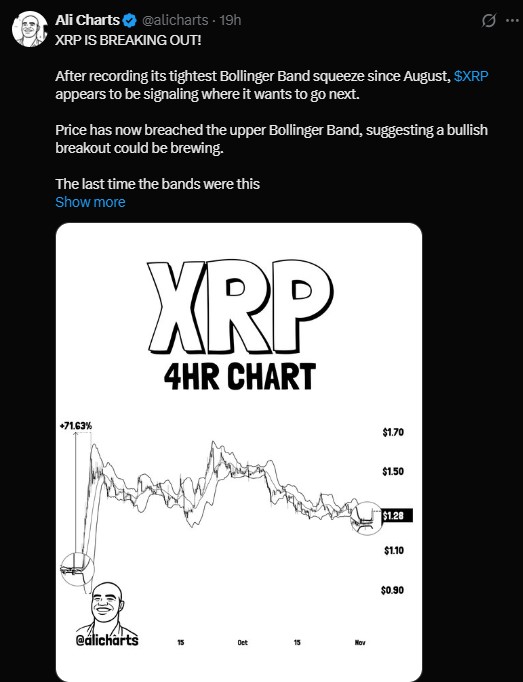
Analyst Javon Marks points to an inverse head and shoulders pattern. He says a reversal toward all-time highs could be in the works. But XRP still sits below the neckline on that chart.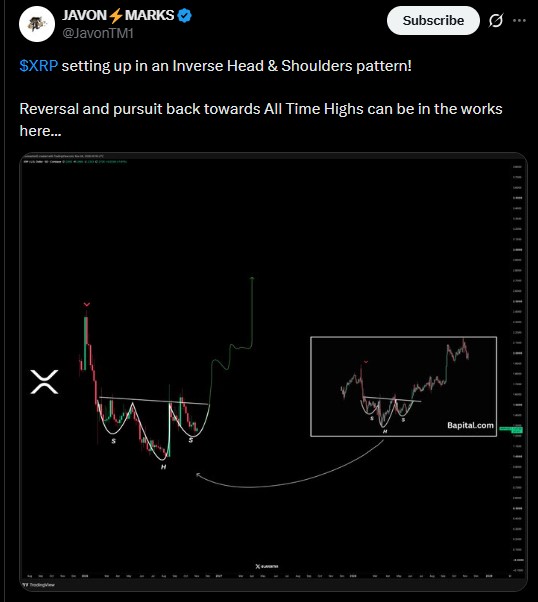
Level
Type
Why It Matters
$1.3592
Resistance
Upper Bollinger Band on the daily chart
$1.32
Resistance
Bulls need a daily close above this
$1.2943
Resistance
Middle Bollinger Band and channel top
$1.25
Support
First stop if buyers fail at the channel
$1.2294
Support
Lower Bollinger Band
The first wall is the $1.2943 to $1.32 zone. A daily close above $1.32 with strong volume would make a channel breakout more likely. That could open a path toward $1.36 and $1.40.
If buyers fail there, a rejection could send price back to $1.25. A retest of $1.23 would follow.
What Traders Should Watch Next After the Senate Shift
Bitcoin, Ethereum, XRP signals are mixed. The 4-hour charts look hopeful, the daily charts look tired, and the Senate news adds a new worry.
Nobody knows which way it breaks. The next few daily closes, ETF flows, and funding rates should offer more clues.
Disclaimer
This article is for information only and is not financial advice. Crypto is volatile and risky, and you can lose some or all of your money. Past results do not guarantee future results. Do your own research and speak with a licensed financial advisor before you invest.