Key Highlights 2.27 million new BTC wallets were created in the past week — the highest weekly reading in 12 months. 751,000 active wallets were recorded, the strongest level in 10 months, pe
Key Highlights
- 2.27 million new BTC wallets were created in the past week — the highest weekly reading in 12 months.
- 751,000 active wallets were recorded, the strongest level in 10 months, per Santiment on-chain data.
- The spike in network activity is primarily attributed to the ongoing Coldcard hardware wallet security issues.
- Bitcoin's long-term ascending support trendline and a momentum oscillator at extreme oversold levels match conditions seen at major bottoms in 2015, 2019, 2020, and 2022.
Bitcoin is printing a rare convergence of signals — a surge in on-chain network activity not seen in over a year, combined with a long-term chart structure that has historically marked major cycle lows. Whether this alignment represents noise or a genuine inflection point is the question every serious BTC watcher is asking right now.
At the time of writing, BTC is trading at approximately $64,956 — up 1.09% in 24 hours and 3.70% over the past 30 days — with a market capitalization of approximately $1.3 trillion. As covered in our Bitcoin price prediction for August 2026, seasonal weakness and bottom-formation signals have been converging for weeks. The latest on-chain data adds another layer to that picture.
 Bitcoin (BTC) Price on 08 Aug 2026 | Source: Coinmarketcap
Bitcoin’s Strongest Network Growth Week in 12 Months
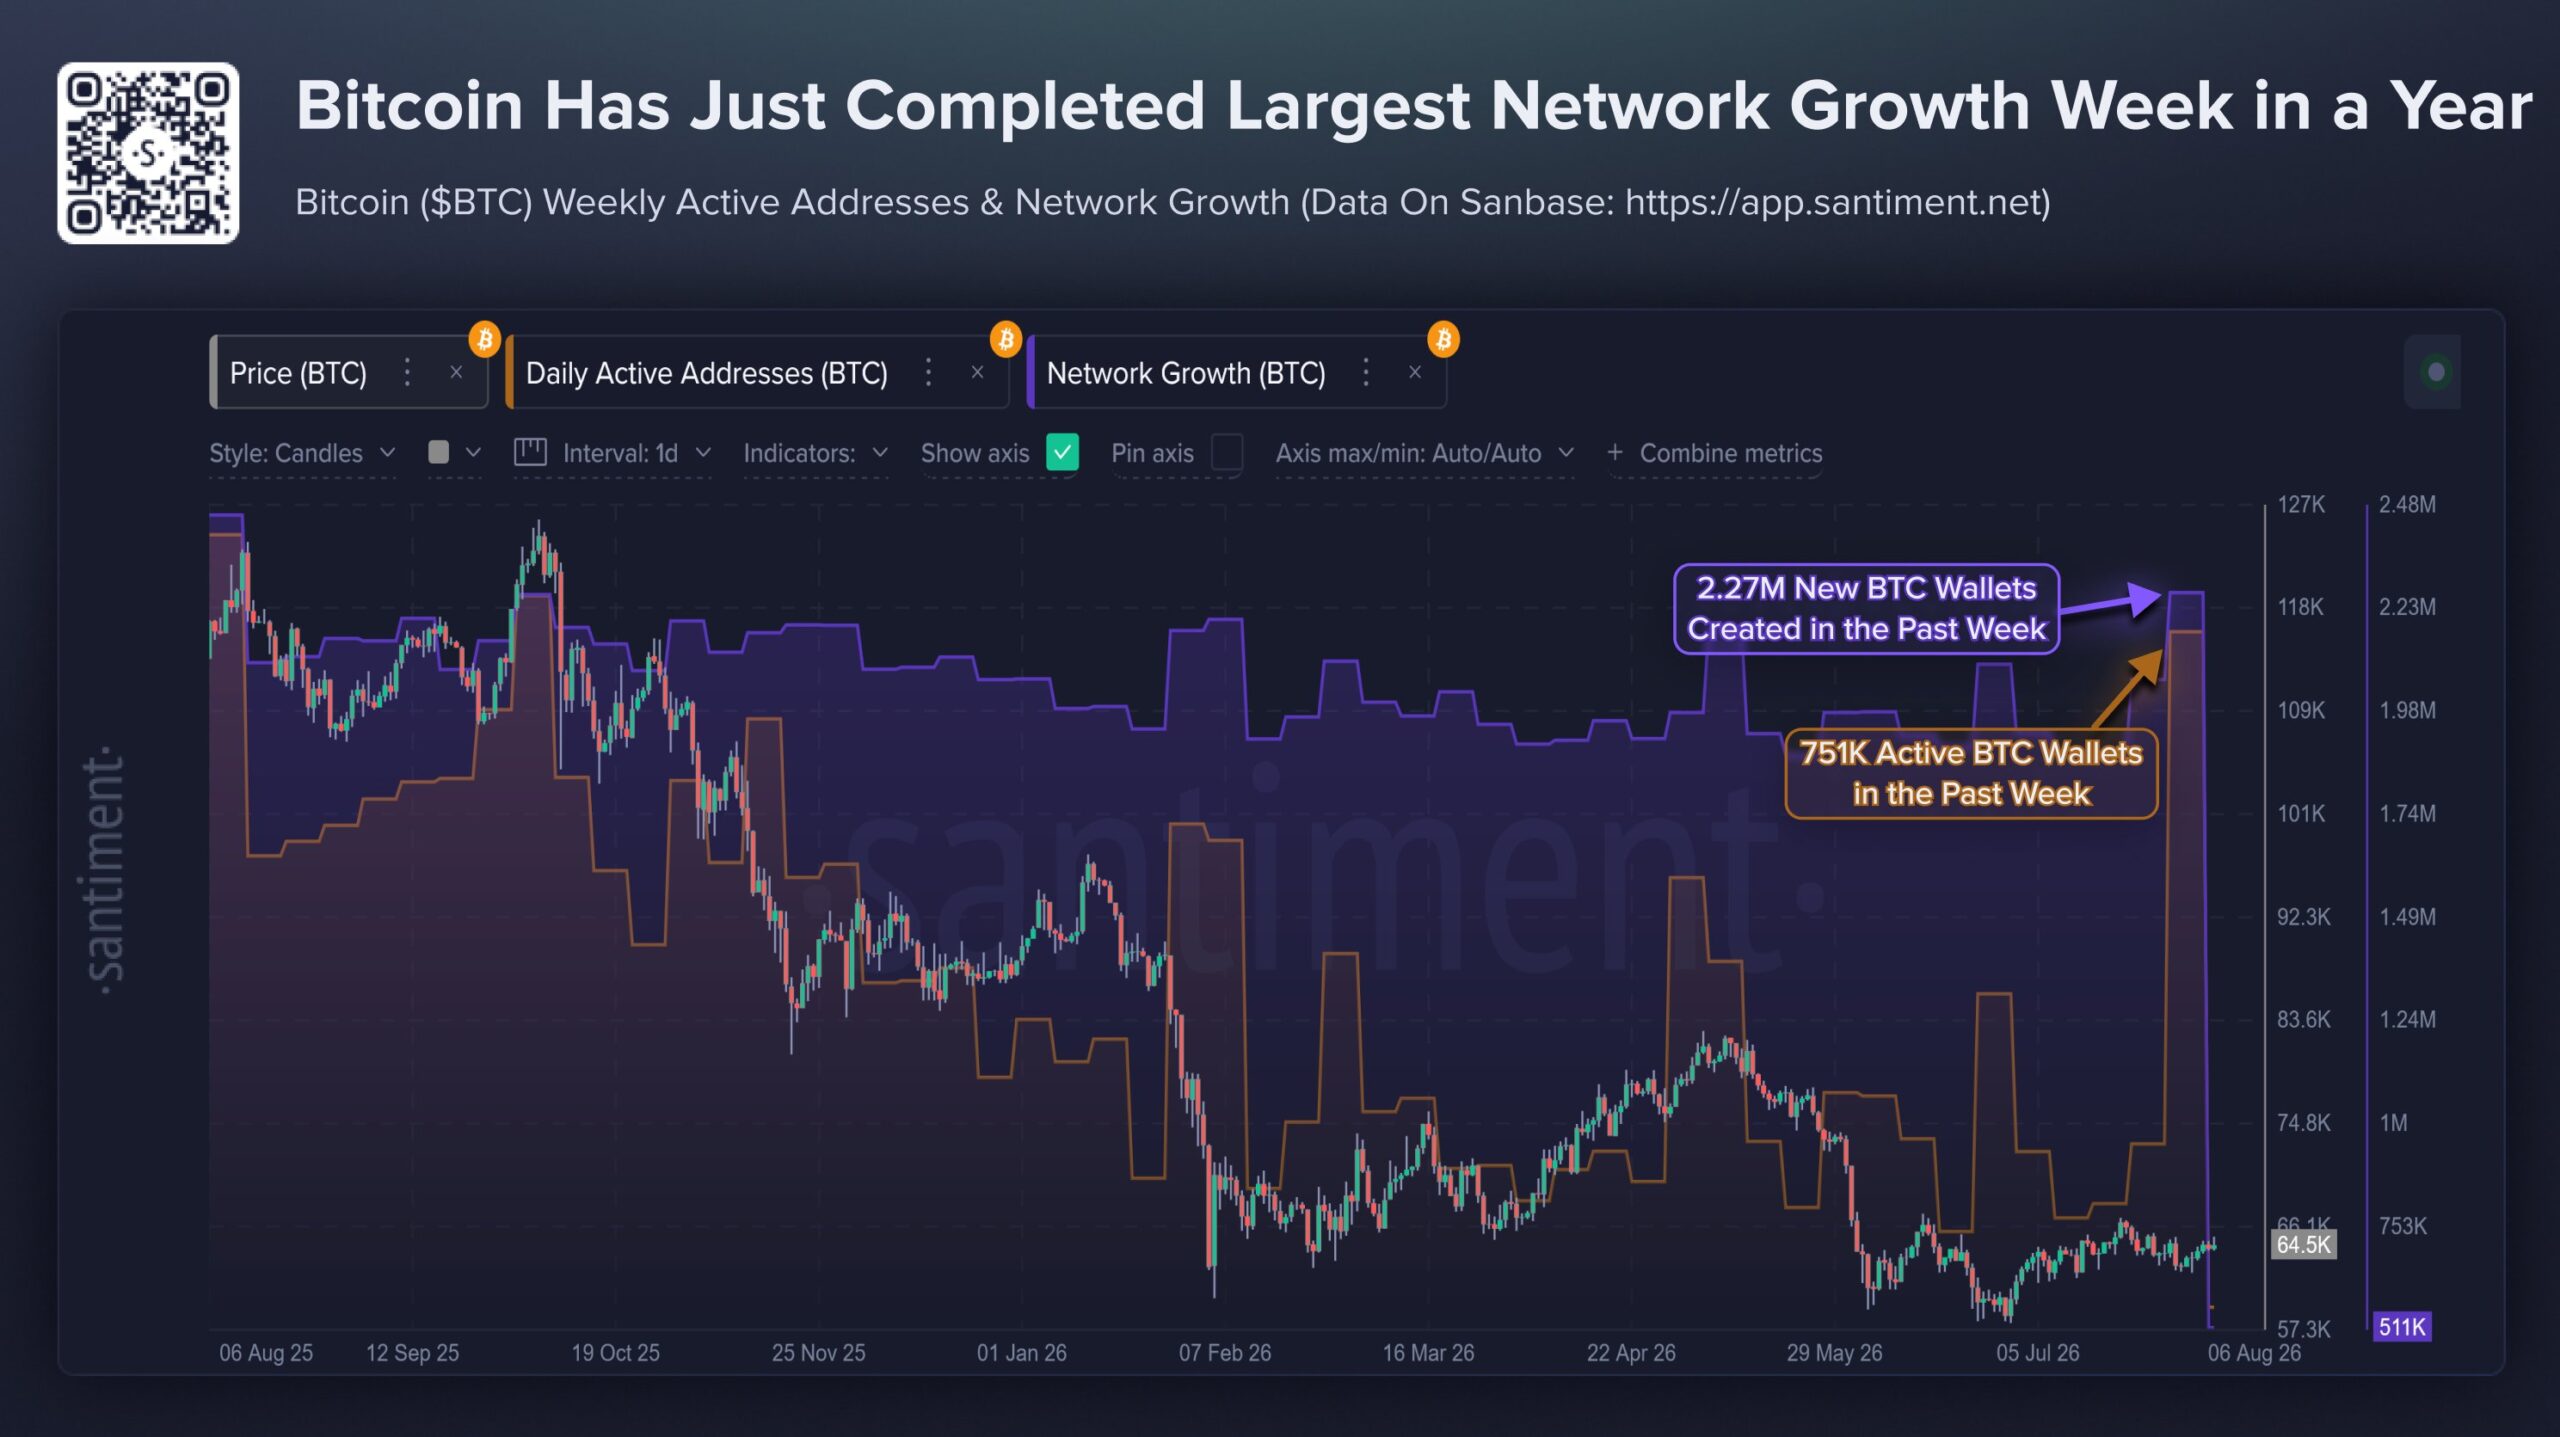
On-chain data from Santiment shows Bitcoin just completed its most significant week of network growth in the past year — across two key metrics that matter for assessing genuine adoption versus price-driven speculation.
 Bitcoin BTC Weekly Active Addresses & Network Growth/Source: @SantimentData (X)
2.27 million new BTC wallets were created in the past week alone — the highest weekly reading in 12 months. This is not a marginal uptick. It is a sharp, anomalous spike that stands out clearly against the baseline of the past year.
751,000 active wallets were recorded over the same period — the strongest active wallet reading in 10 months. Active wallet counts reflect real on-chain transactions, not just the creation of dormant addresses, making this metric a stronger signal of genuine network engagement.
The Coldcard Effect — Security Shock Driving On-Chain Activity
Santiment attributes the bulk of this spike directly to the ongoing Coldcard hardware wallet security issues that have been circulating in the Bitcoin community.
Security events of this nature have a predictable and historically consistent effect on on-chain behavior. When confidence in a specific custody solution is shaken, users respond by:
- Creating new wallets and rotating their custody setup
- Moving funds off potentially compromised devices
- Reassessing their overall security architecture
Each of these actions generates on-chain transactions and new wallet creation — explaining the anomalous readings in both metrics this week.
Why This Actually Matters for Price
The instinctive reaction to “security scare drives wallet creation” might be to dismiss the data as noise — activity generated by fear rather than conviction. But the historical pattern tells a different story.
As Santiment’s framework has consistently shown, polarizing events produce the strongest on-chain reactions — and those reactions are not uniformly bearish. Fear spreads quickly among smaller holders, activity spikes as people rotate custody, and larger stakeholders frequently use the resulting confusion and temporary price weakness to accumulate more aggressively.
This dynamic maps directly onto what we covered in our Bitcoin whales accumulate as retail sells analysis — a pattern where sophisticated larger holders use retail panic as a buying window. The combination of rising network usage and stronger-hand accumulation has historically been constructive for Bitcoin’s price trajectory over the following weeks and months.
Long-Term Chart Flashes Familiar Bottom Signal
The on-chain data doesn’t exist in isolation. Analyst James Easton (@JamesEastonUK) shared a long-term Bitcoin chart with a caption that captures the weight of the current technical setup:
“Bitcoin. I literally don’t know what to say.”
The chart maps Bitcoin’s multi-year ascending support trendline — and price is currently testing that long-term structure near the $65,000 region.
 Chart: Bitcoin/USD Monthly | Source: TradingView, @JamesEastonUK, August 07, 2026
What the Chart Shows
The ascending trendline (marked in white on Easton’s chart) has served as long-term support across Bitcoin’s entire multi-year cycle structure. Cyan circles on the chart mark previous instances where BTC interacted with this trendline at major cycle turning points — each instance preceding a significant directional move.
Price is currently sitting at that trendline again.
The Momentum Oscillator Signal
The lower panel of the chart adds the most historically significant element. A momentum oscillator has dropped to extreme oversold levels — matching the same deep red readings that appeared at prior major Bitcoin bottoms:
- 2015 — the end of the post-Mt. Gox bear market
- 2019 — the mid-cycle low before the 2020 run
- 2020 — the COVID crash low
- 2022 — the cycle bottom near $15,500
Each of those oversold readings on the same oscillator preceded a significant and sustained upward move. The current reading matches that zone.
As we noted in our Bitcoin macro bottom signals analysis, the convergence of multiple independent indicators pointing to the same conclusion carries more analytical weight than any single signal in isolation.
How This Fits the Broader Bottom Framework
This week’s data does not stand alone. It adds to a growing body of evidence that Bitcoin may be operating near or at a significant structural low — a thesis supported by several independent frameworks covered in prior analysis:
Realized Profit vs. Realized Loss: As covered in our BTC realized profit crossover analysis, Bitcoin has historically bottomed when realized profit crosses realized loss — and another such crossover is approaching.
Two independent valuation models: Both models examined in our BTC undervaluation analysis point to the same conclusion — Bitcoin is currently trading below fair value by their respective metrics.
Whale accumulation: The smart money behavior pattern documented in our whale accumulation report shows larger holders continuing to accumulate while retail participants reduce exposure — a historically bullish divergence.
The network growth data from this week now adds on-chain confirmation to what the technical and valuation frameworks have been suggesting.
What to Watch Next
Two things will determine whether this convergence of signals marks a genuine inflection point or a temporary blip:
Whether the ascending trendline holds: Bitcoin is currently testing multi-year ascending support near $65,000. A sustained daily close below this trendline would weaken the long-term bullish structure significantly and shift the analytical framework toward a deeper correction scenario.
Whether network growth sustains: If the wallet creation and active address spike is purely Coldcard-driven, it may fade quickly once the security situation stabilizes. If the numbers remain elevated in the coming weeks — suggesting genuine adoption beyond the security event — that would add meaningful weight to the bullish case.
Bottom Line
Bitcoin is presenting a rare alignment of signals this week. The strongest on-chain network growth in 12 months — driven in part by the Coldcard security situation — is occurring simultaneously with a long-term chart test of multi-year ascending support and a momentum oscillator reading that has historically marked major BTC bottoms.
No single signal guarantees a directional outcome. But as our broader bottom analysis has documented across multiple independent frameworks, the weight of evidence currently points toward Bitcoin operating near a structurally significant low rather than the early stages of an extended decline.
The trendline at $65,000 is the level to watch. How Bitcoin closes around it over the coming days will clarify whether this is the setup that precedes the next major move — or a test that still needs more time to resolve.
Disclaimer: The views and analysis presented in this article are for informational purposes only and reflect the author’s perspective, not financial advice. Technical patterns and indicators discussed are subject to market volatility and may or may not yield the anticipated results. Investors are advised to exercise caution, conduct independent research, and make decisions aligned with their individual risk tolerance.
Read Also: Is Bitcoin’s Macro Bottom Already In? 3 Signals Point to Bullish Market