Key Highlights Bitcoin trades at $67,267 (-2.25% 24h) as the midterm cycle pattern triggers for the fourth consecutive time Alphractal flagged the post-Nov 3 decline on Oct 28 — it occurred e
Key Highlights
Bitcoin trades at $67,267 (-2.25% 24h) as the midterm cycle pattern triggers for the fourth consecutive time
Alphractal flagged the post-Nov 3 decline on Oct 28 — it occurred exactly as warned, repeating 2014, 2018, and 2022 behavior
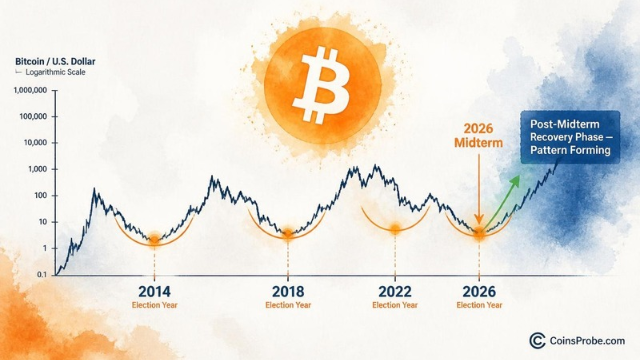
Pattern is still forming — chart marks current price at the 2026 midterm orange marker, with post-midterm recovery phase beginning
Bitcoin is trading at $67,267 — down 2.25% in the past 24 hours and sitting at approximately $1.35 trillion in market capitalization — as a recurring historical pattern plays out with uncomfortable precision for the fourth consecutive cycle. The midterm election cycle alignment that has marked every major Bitcoin bear market bottom since 2014 has triggered again, and this time was no different: Bitcoin declined after November 3, exactly as a prior analysis had flagged.
Analysts at Alphractal published a warning on October 28 identifying the historical pattern surrounding U.S. midterm elections and Bitcoin’s bear market cycles. When November 3 passed and Bitcoin declined, that warning proved correct. The post, published on November 13, 2026, stated: “November 3 has now passed, and Bitcoin has declined once again, just as we warned.” What makes this more than a coincidence is that the same alignment has appeared in 2014, 2018, and 2022 — three consecutive cycles before this one.
The core observation from Alphractal is structural: Bitcoin’s 4-year price cycle and the U.S. political/liquidity cycle around midterm elections have overlapped repeatedly to produce bear market lows near midterm periods. The pattern is not about election outcomes — it is about the timing alignment between Bitcoin’s halving-driven supply cycle and the fiscal and monetary backdrop that shifts around U.S. midterm years. As Alphractal explicitly notes, correlation does not equal causation. But a signal that has appeared in 2014, 2018, 2022, and now 2026 is not random noise.
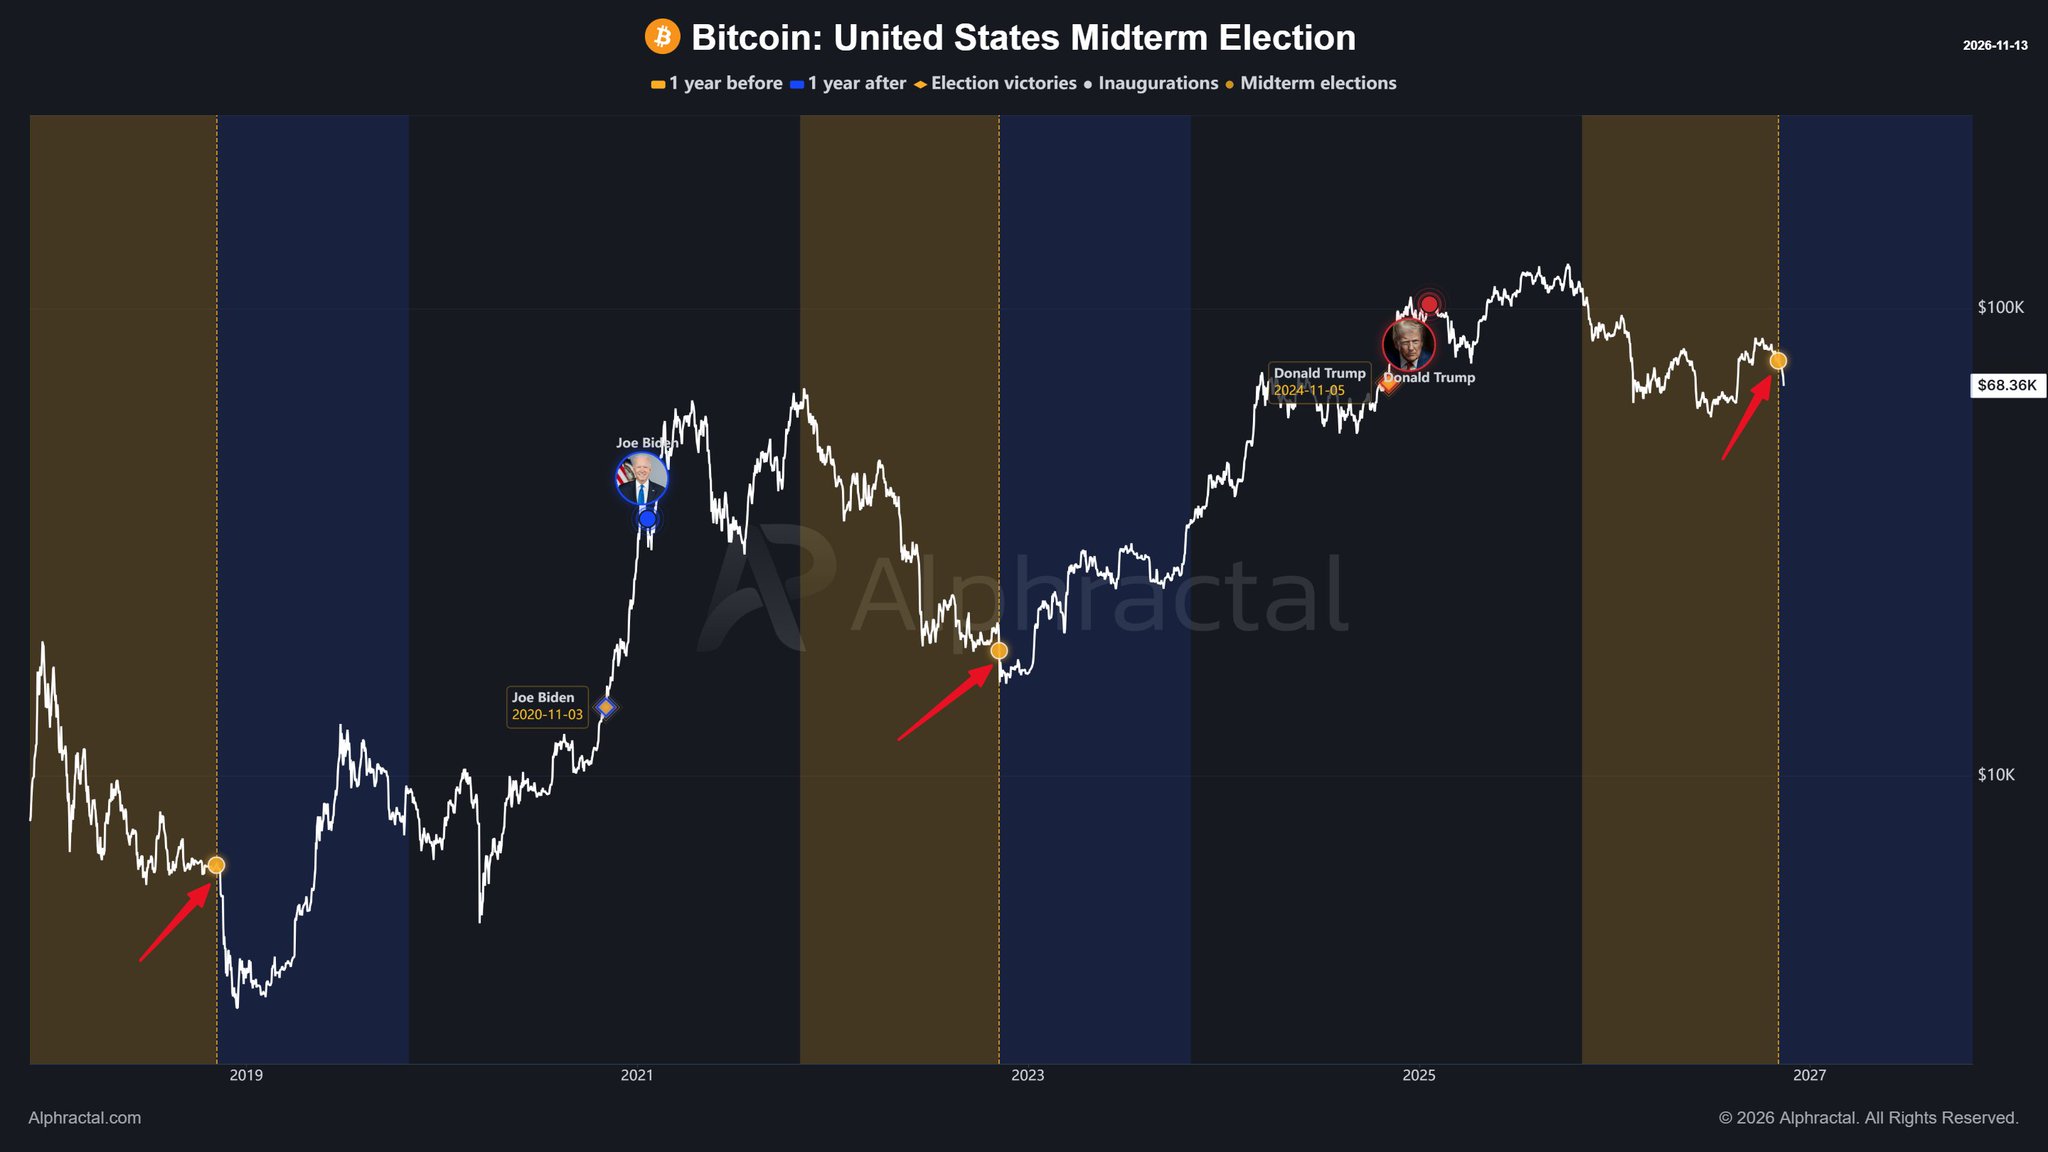
The first chart shared by Alphractal covers Bitcoin’s price history from approximately 2018 through a projected 2027 window on a logarithmic scale. It marks U.S. presidential election dates — November 3, 2020 (Biden) and November 5, 2024 (Trump) — alongside midterm periods identified by orange dots with arrows. The current price on the chart is labeled at $68,360, sitting precisely at the 2026 midterm orange marker. The blue shaded zones extending one year after each election date illustrate where Bitcoin’s recovery phases have historically begun. The pattern status is still forming: price is at the historically significant midterm marker, with the anticipated post-midterm recovery phase only beginning to take shape based on the repeating structure.
Bitcoin Midterm Cycle Pattern | Source: @Alphractal (X)
This matters because the Bitcoin demand picture has also deteriorated meaningfully in parallel. As covered previously on CoinsProbe, Bitcoin demand collapsed to -362,000 BTC as miner flows surged 16-fold — a reading that is consistent with a late-cycle capitulation environment, not a mid-rally correction.
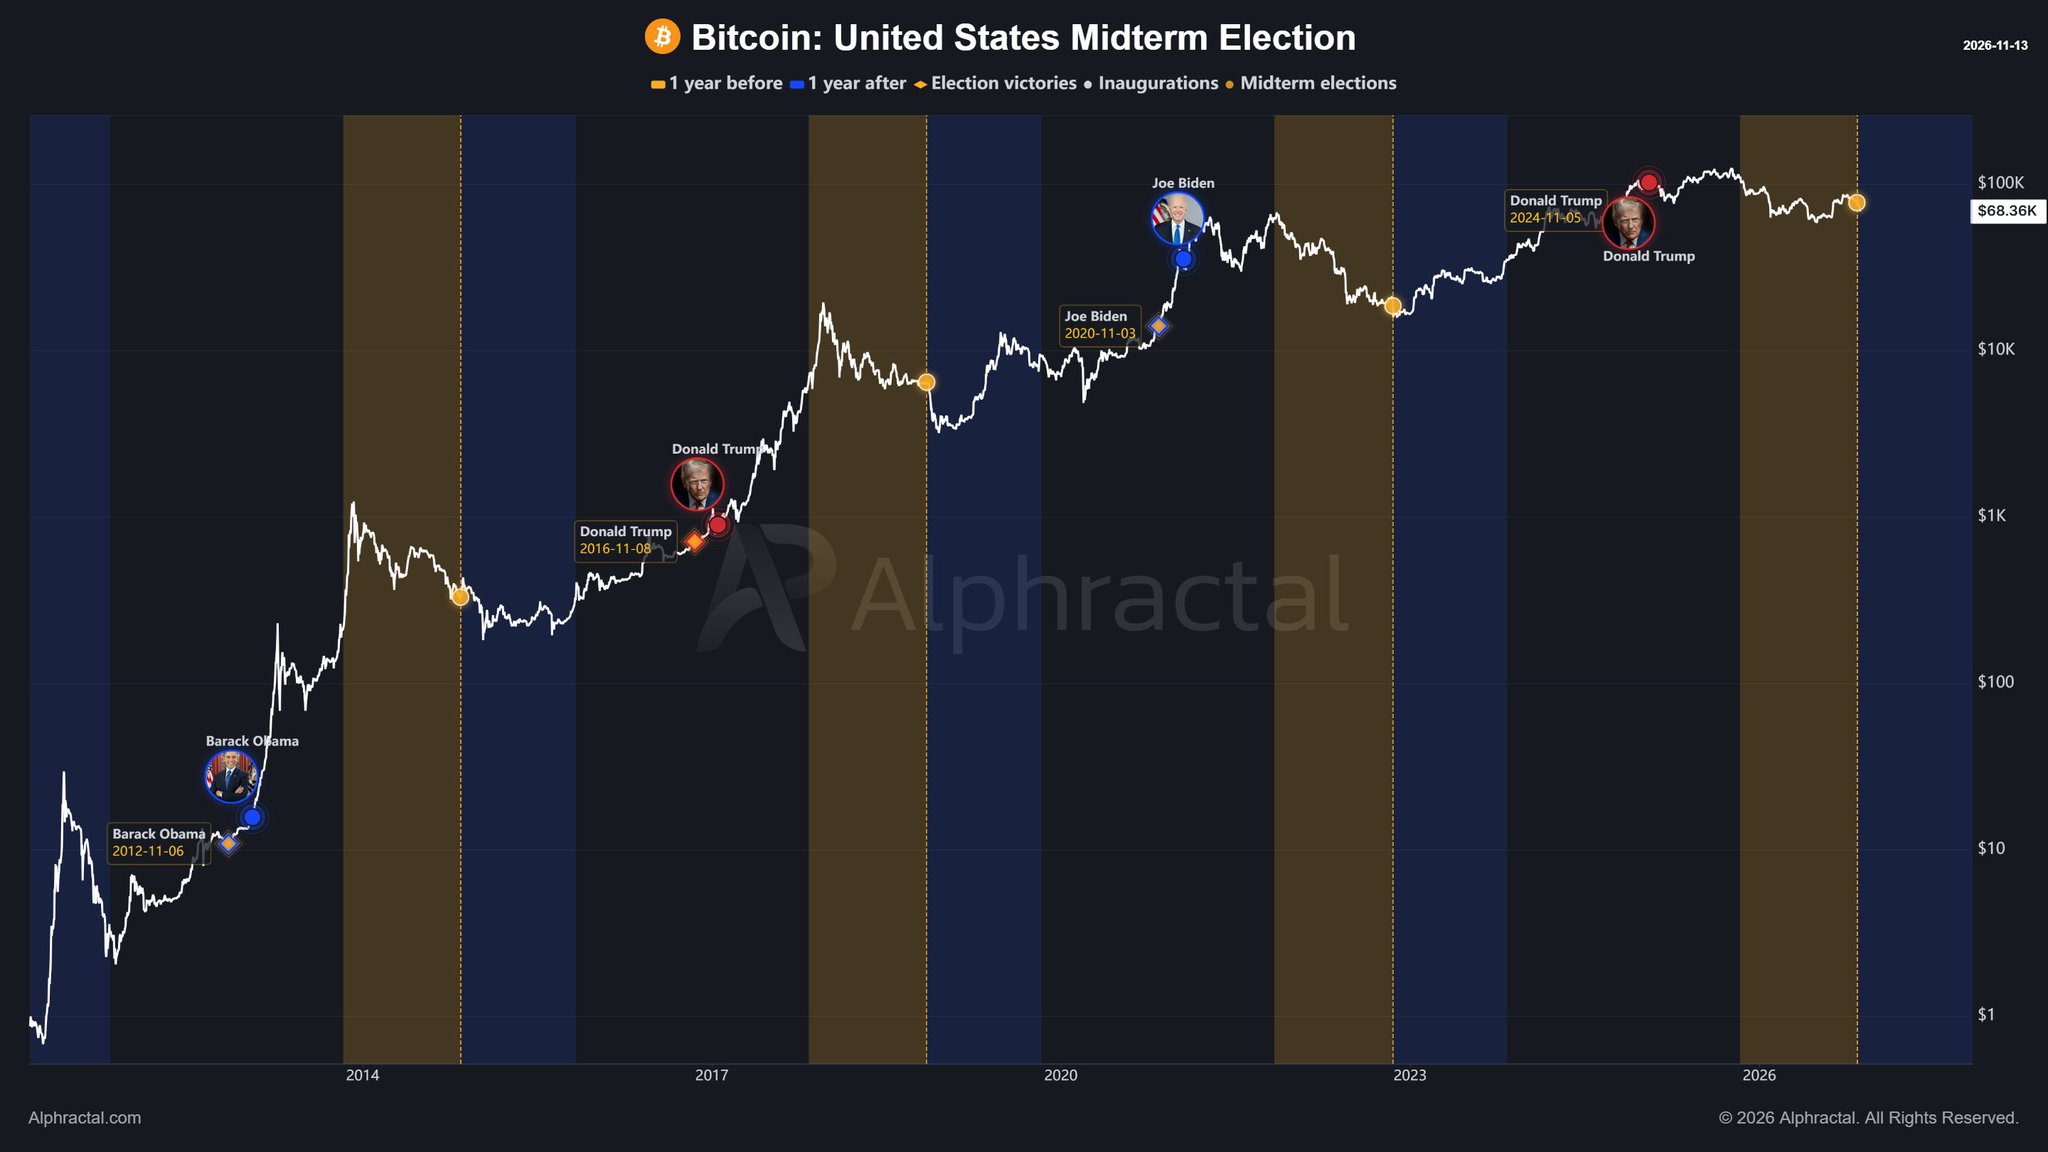
The second chart extends the view back to 2012, covering the full multi-cycle logarithmic structure. It alternates dark-blue vertical bands (one year before each election) with gold bands (one year after each election), revealing that Bitcoin’s sharpest rallies have consistently followed election-adjacent periods across every cycle since 2012. The election dates marked are November 6, 2012; November 8, 2016; November 3, 2020; and November 5, 2024. Bitcoin’s current position is labeled at $68,360 on the right axis, sitting below the $100,000 level — within the post-2024 election gold band and tracking the same trajectory that followed the 2012, 2016, and 2020 windows.
Bitcoin Midterm Cycle Pattern | Source: @Alphractal (X)
No percentage labels appear on this chart, and no specific price targets are stated by the analyst. The chart’s right axis prints $1, $10, $100, $1,000, $10,000, and $100,000 as logarithmic reference ticks — these are display boundaries, not price targets. The takeaway from the structure is directional and historical: each cycle produced a sharp recovery from the midterm-aligned low. Whether the current cycle does the same remains the open question Alphractal poses explicitly.
Alphractal does not answer this definitively — and that restraint is itself informative. The analysis asks whether the cycle bottom has already been reached or whether a final capitulation remains ahead. The November 3 decline confirmed the pattern’s short-term predictive accuracy. But the same historical cycles that produced midterm-adjacent bottoms also produced deeper flushes before the recovery began in some instances.
What the data shows with clarity: Bitcoin has never sustained a new all-time high without first resolving the midterm cycle low. The resolution of that low — whether it has already occurred or is still pending — is what the current price action is testing. At $67,267, Bitcoin remains well below the $100,000 level visible as the next major logarithmic reference on the chart. The loss of the 200-day moving average earlier in this cycle placed the 200-week MA as the critical structural floor, adding another layer of technical context to the midterm pattern’s current phase.
It is also worth noting the broader market backdrop: crypto market capital momentum has turned negative, with the Realized Cap Impulse hitting −0.99 — a reading that aligns with the demand collapse and cycle-low environment the midterm pattern has historically produced before its recovery phase begins.
The Alphractal midterm cycle analysis says: Bitcoin has declined near U.S. midterm periods in 2014, 2018, 2022, and 2026 — four consecutive instances. The November 3, 2026 post-midterm decline was flagged in advance and occurred as expected.
What it does not say: it does not specify a bottom price level, a recovery target, a timeline for reversal, or a confirmation trigger. The analyst explicitly notes that correlation does not imply causation. The pattern is a historical observation — not a purchase signal.
What to watch for continuation: the same post-midterm gold bands on the second chart that preceded Bitcoin’s recoveries after 2012, 2016, and 2020 are now active for the 2024–2025 window. Whether price begins tracking the recovery trajectory within those bands — rather than extending the decline — is the testable condition the pattern points toward.
The midterm cycle pattern is four-for-four on identifying Bitcoin declines near these periods. Whether the recovery phase now follows as it did in every prior cycle will be answered at current price levels and in the weeks immediately ahead. Watch $67,267 — a sustained breakdown below this level would extend the capitulation phase the pattern has historically produced before its reversals began.
Disclaimer: The views and analysis presented in this article are for informational purposes only and reflect the author’s perspective, not financial advice. Technical patterns and indicators discussed are subject to market volatility and may or may not yield the anticipated results. Investors are advised to exercise caution, conduct independent research, and make decisions aligned with their individual risk tolerance.
Also Read: Bitcoin Loses 200-Day MA — The 200-Week MA Is Now the Last Line