Bitcoin price today is trading near $77,509, down about 2.93% over the past 24 hours. The pullback comes right after a hawkish speech from Federal Reserve Chair Kevin Warsh at Jackson Hole, a
Bitcoin price today is trading near $77,509, down about 2.93% over the past 24 hours. The pullback comes right after a hawkish speech from Federal Reserve Chair Kevin Warsh at Jackson Hole, and it has traders asking the same question again: why is bitcoin going down today, and where does it go from here?
This bitcoin price prediction looks at the charts, the whale data, and the macro backdrop to figure out what might happen next.
Why Is Bitcoin Going Down Today?
The short answer is the Fed. Kevin Warsh spoke at Jackson Hole and struck a tone that markets did not love.
According to CNBC, Warsh said recent PCE and CPI readings came in better than expected, but they did not show that underlying inflation trends had meaningfully improved. He avoided pointing to a specific rate path.
Instead, he pushed for a "quieter Fed," one that leans less on forward guidance, and said markets should not look mainly to the central bank for their next trade.
That kind of vague, non-committal tone tends to spook risk assets. Bitcoin, along with stocks, felt the pressure almost right away.
The drop also comes right after a historic run. According to Galaxy Research, the price rose from $62,818 to $77,593 between August 17 and August 23, a weekly gain of $14,775, the largest weekly dollar increase ever recorded. On a percentage basis, that 23.5% jump was the biggest weekly gain since March 2023.
Bitcoin Price Today: Key Numbers
Here is a snapshot of where things stand right now.
Metric
Value
BTC price
$77,509
24h change
-2.93%
24h trading volume
~$71.23 billion
Open interest
~$54.08 billion
Long liquidations (24h)
$130.21 million
Short liquidations (24h)
$22.04 million
Long/Short ratio (Binance)
1.173
Both volume and open interest are falling, which usually points to cooling derivatives activity. But the long/short ratio on Binance and OKX still leans bullish, meaning traders have not given up on higher prices yet.
The liquidation data tells its own story. Longs got hurt far more than shorts in the last 24 hours, a sign that many traders were caught leaning bullish right before the drop.
Bitcoin Price Prediction: What the 1-Hour Chart Shows
Looking at the 1-hour BTC/USD chart, the setup looks like a short-term bearish correction after a failed breakout above $80,000.
Price is currently trading below the 20, 50, and 100 EMAs, and RSI has dropped to around 32.7. That is close to oversold territory.
The chart shows a clear rejection near $81,000, followed by a string of lower highs and a sharp break through the EMA cluster. That lines up with the recent pullback from about $81,300 down toward $77,800.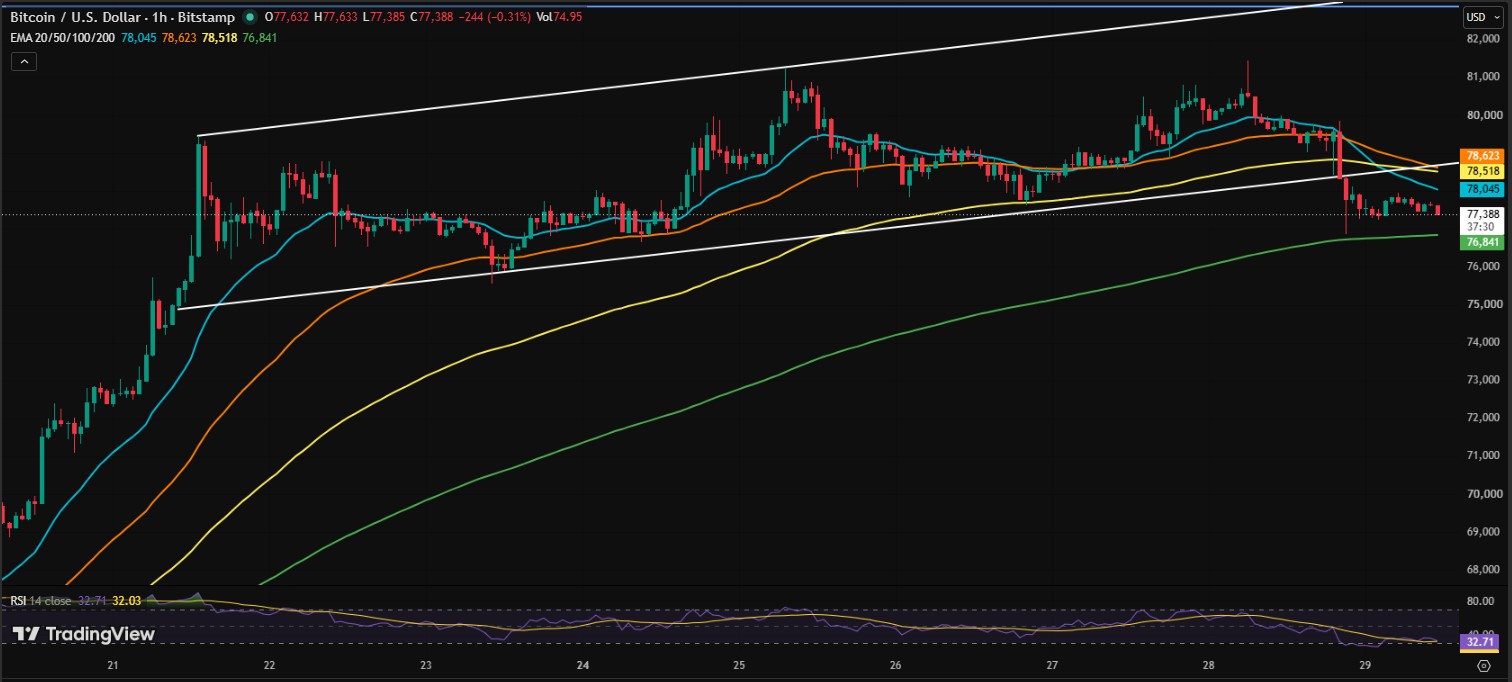
Most Likely Path For BTC Price
Based on the chart pattern, the most likely near-term path looks something like this:
$77.3K → $76.8K–$76.0K
Possible bounce
Retest of $77.8K–$78.6K
The level to watch closely is $76.8K to $77.0K. That zone lines up with a rising trendline and the 200 EMA on the hourly chart.
If $76.8K holds, a relief bounce could aim for:
$78.0K, first resistance
$78.5K–$78.7K, EMA 50/100 resistance zone
$79.5K–$80K, major recovery target
$81K–$81.3K, previous swing high
If the asset closes an hourly candle below roughly $76.8K, the bullish structure weakens. In that case, $75.8K to $75.0K becomes the next zone to watch, with $74K possible if selling picks up speed.
Right now, the odds lean toward sideways-to-down action first, with a bounce attempt afterward. This is not a guaranteed outcome, just a read of the current chart structure.
Bitcoin Whales Are Buying While Retail Sells
One of the more interesting data points this week comes from on-chain activity. Since August 1, BTC price jumped from $62,229 to $81,500, a huge move in less than a month.
But smaller wallets did not join the rally. Wallets holding between 0.1 and 1 BTC recorded an Accumulation Trend Score of -0.982, meaning retail holders were net sellers through most of the run-up.
Meanwhile, whales holding 100 or more BTC kept accumulating. That divergence, retail selling into strength while whales buy the dip, is a pattern worth watching for anyone thinking about the next leg.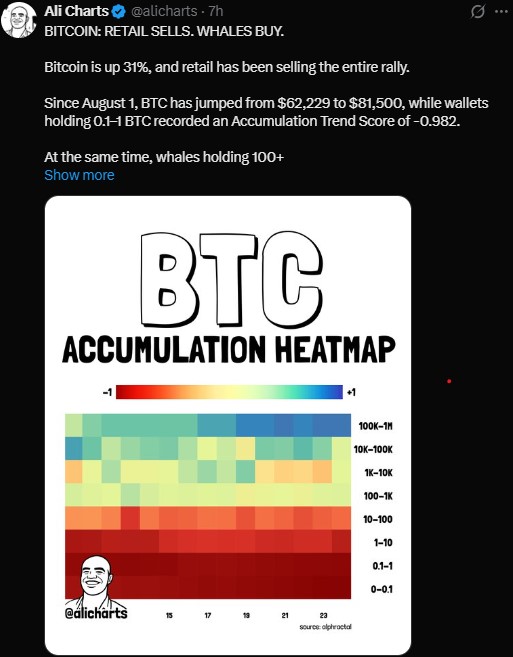
Bitcoin MVRV Bands Point To $100K If Support Holds
Zooming out, the MVRV Pricing Bands offer a longer-term picture.
The -0.5 MVRV band currently sits at $73,880. As long as the price holds above that level, the bands suggest $100,000 could be the next major target over time.
On the upside, the bands get more ambitious. The Mean band sits near $126,223, and the +1.0 band, the most extended zone, sits up at $152,394. Those levels are far off, but they show where the bands see room to run if the bull trend keeps going.
Below current price, the -1.0 band sits near $52,678, and the Realized Price sits around $47,560. Those levels would only come into focus in a much deeper pullback scenario.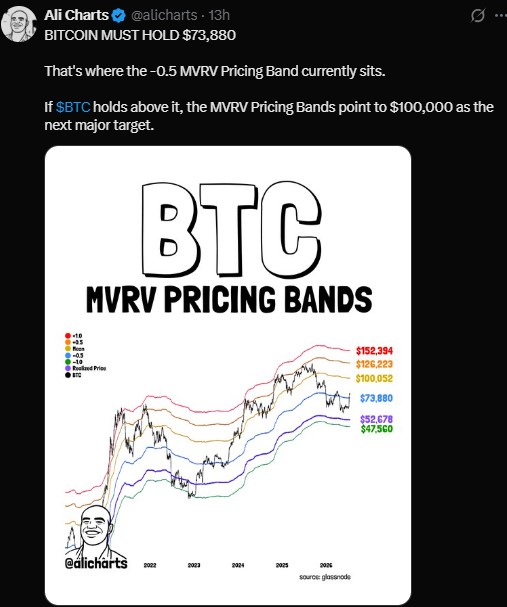
Bitcoin Price Prediction 2026: The Bigger Picture
A few macro threads are shaping the longer-term bitcoin price prediction for 2026.
Grayscale's Head of Research, Zach Pandl, pointed out that Bitcoin's 90-day correlation with the Nasdaq 100 has fallen from over 60% to roughly 33%, while its correlation with gold has climbed from near zero at the start of the year to above 50%.
That shift suggests investors are starting to treat Bitcoin more like a scarce, independent store of value, similar to gold, rather than just another tech-correlated risk asset. With U.S. federal debt above $40 trillion and deficits staying persistent, the "debasement trade" is back in focus.
There's also a chart pattern some analysts are watching closely. It shows Bitcoin's current structure echoing 2023, when price broke its downtrend, retested the prior August high, then pulled back before eventually rallying hard. The comparable level this time is the May 2026 high near $83,000.
On the flow side, spot BTC ETFs just snapped a nine-day inflow streak. SoSoValue data shows $202 million in net outflows on August 28, which adds some short-term caution to an otherwise strong month for Bitcoin.
Bottom Line
Bitcoin price today sits at a tricky spot after this week's Fed-driven pullback. The $76.8K to $77K zone is the level to watch on the hourly chart, and $73,880 matters for the bigger picture.
Whale accumulation and rising gold correlation are longer-term positives, but ETF outflows and stretched retail positioning suggest more chop before any clean move higher.
As always with a bitcoin price prediction, nothing here is set in stone, and traders should watch price action as it develops rather than assume any single outcome.
Disclaimer: This article is for informational purposes only and does not constitute financial, investment, or trading advice. Cryptocurrency prices are highly volatile, and past performance does not guarantee future results. Always do your own research and consult a licensed financial advisor before making any investment decisions.