The Zcash price prediction is heating up as ZEC works its way up an ascending trendline that has already delivered one higher high, and now it is coming back for a second look at that same zo
The Zcash price prediction is heating up as ZEC works its way up an ascending trendline that has already delivered one higher high, and now it is coming back for a second look at that same zone.
Second retests like this tend to matter, because they show whether the earlier strength was real momentum or just a temporary push.
If ZEC can finally clear this ceiling, the round number sitting just above it is hard to ignore.
Here is the full breakdown of what the chart, the data, and the latest research note are showing.
Zcash Price Today: Live Data and 24-Hour Change
ZEC is trading at $791.91 at the time of writing, down a modest 0.05 percent, a drop of $0.3962 over the past 24 hours.
Futures volume over the same period stands at $3.35 billion while spot volume sits at $254.65 million, showing that leveraged trading is doing most of the work in this move.
Market cap is holding at $13.34 billion, open interest is at $1.63 billion, and circulating supply is 16.84 million ZEC, already close to the fixed max supply of 21.00 million tokens.
Source: CoinGlass, August 29, 2026.
Zcash Latest News and Catalyst
Alongside the chart, ZEC is getting attention from a fresh research angle.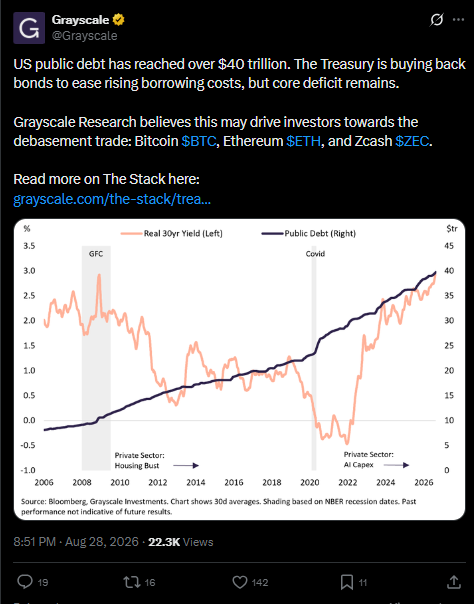
According to a post from Grayscale, US public debt has crossed $40 trillion, and while the Treasury is buying back bonds to ease borrowing costs, the core deficit remains in place.
Grayscale Research suggests this backdrop could push investors toward what it calls the debasement trade, naming Bitcoin, Ethereum, and Zcash specifically as assets that could benefit from that shift.
This kind of macro framing does not move price on its own, but it adds a layer of long-term narrative support to ZEC's current price outlook.
Source: Grayscale on X, August 28, 2026.
Zcash Liquidation Data and Market Positioning
Liquidation activity over the past day has leaned firmly toward longs, even though price itself has barely moved.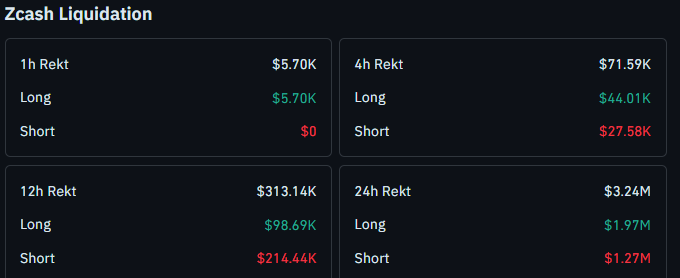
Over the last 24 hours, $3.24M in positions were liquidated, with $1.97M coming from longs against $1.27M from shorts.
The 12-hour window shows $313.14K total rekt, and here the balance flips, $214.44K from shorts versus $98.69K from longs.
In the most recent 4-hour window, $71.59K was liquidated overall, split between $44.01K in longs and $27.58K in shorts, suggesting positioning has been choppy on both sides as ZEC grinds toward this trendline retest.
Source: CoinGlass liquidation data, August 29, 2026.
Quick Take
CMP: $791.91 on the 1-hour Binance perpetual chart
Bullish trigger: 1 hour close above $888.88 needed to confirm the trendline breakout past the prior higher high
Bullish continuation level: $1,000, a key psychological resistance
Bearish trigger: 1 hour close below $751.83
Bearish target on breakdown: $692.53
Data timestamp: August 29, 2026, 13:40 UTC+5:30
Risk note: ZEC is at a second retest of a level that already produced one higher high, so confirmation on a closing basis matters more than a quick wick through either side
Zcash Technical Analysis August 2026
The 1-hour ZEC/USDT perpetual chart on Binance shows price climbing steadily along an ascending trendline that has been in play for the better part of a week.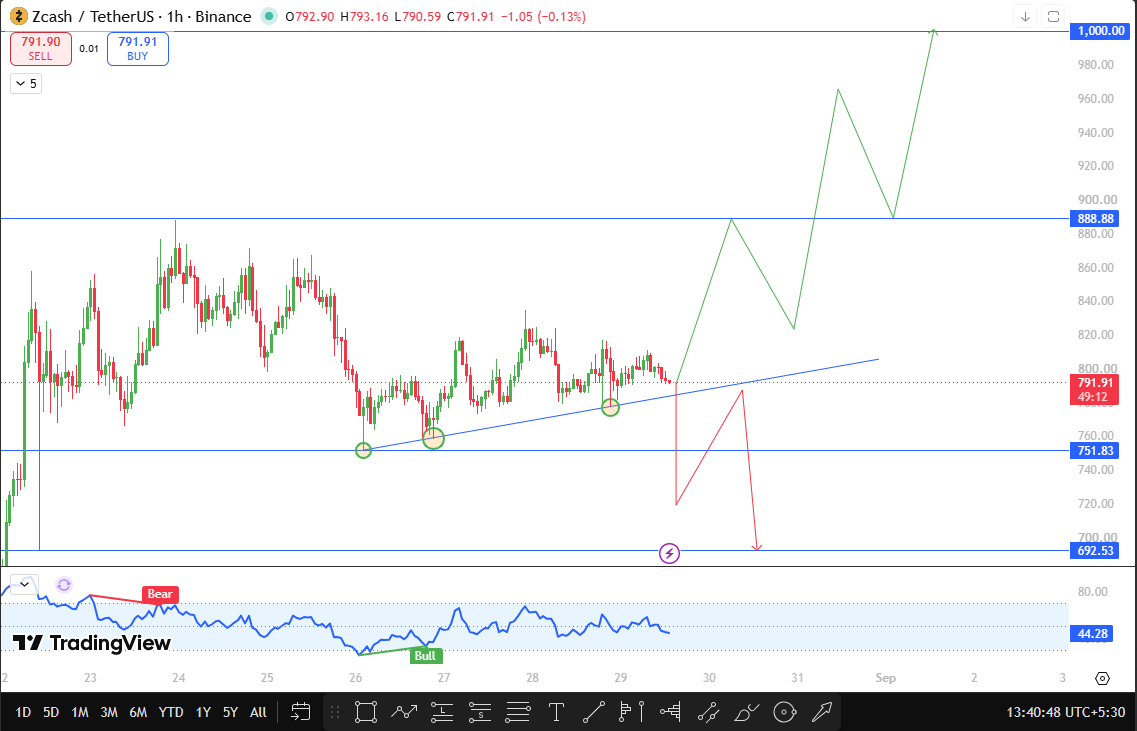
On the first retest of this trendline, ZEC pushed through and printed a new higher high, a solid sign of underlying strength.
Now, on this second retest, price has come back into the same zone, but so far it has not managed to break above that earlier high.
If ZEC finally clears this resistance and closes above $888.88 on the 1-hour chart, that would confirm the breakout is real rather than another failed attempt.
From there, the next major resistance is the psychological $1,000 mark, a level that tends to attract heavy attention simply because of the round number, and it could act as a magnet for both buyers looking to take profit and sellers looking to fade the move.
On the downside, if ZEC fails to hold this trendline structure and closes below $751.83 on the 1-hour timeframe, that would point to weakening momentum.
In that case, the next support to watch drops to $692.53. Given that ZEC has already shown it can break out from this trendline once, a clean close above $888.88 this time would carry extra weight in this Zcash technical analysis.
Source: TradingView, ZEC/USDT Perpetual, 1-hour chart, Binance, August 29, 2026.
ZEC Support and Resistance Levels
Level Type
Price
Note
Resistance 2
$1,000
Major psychological resistance
Resistance 1
$888.88
Confirmation level for trendline breakout, prior higher high
Current Price
$791.91
CMP on 1-hour chart, second trendline retest
Support 1
$751.83
Trendline structure support
Support 2
$692.53
Deeper support level
Bull, Base, and Bear Case for ZEC
In the bull case, ZEC clears the second retest, closes above $888.88, and pushes toward the $1,000 psychological level as buyers lean into the breakout.
The base case has $ZEC continuing to chop around this trendline zone without a clean close on either side, essentially consolidating while the market decides whether the earlier higher high can be repeated.
In the bear case, $ZEC fails this retest, closes below $751.83, and price works its way toward $692.53, undoing the recent trendline structure.
Risks to This Zcash Price Prediction
The main risk here is a repeat failure at this same retest zone, which would suggest the earlier higher high was closer to a temporary spike than a genuine trend shift.
Broader market volatility, sudden moves in Bitcoin or Ethereum, and shifts in overall risk appetite across crypto could easily override this setup regardless of how ZEC's own chart is behaving.
This Zcash price forecast is based purely on current chart structure and available data, and conditions can change quickly.
Glossary
CMP: Current Market Price, the price at which an asset is trading right now.Ascending Trendline: A rising line connecting a series of higher lows, used to track the direction and strength of an uptrend.Psychological Resistance: A round number level, like $1,000, where traders commonly expect increased buying or selling activity.Liquidation: The forced closing of a leveraged position when losses exceed the trader's available margin.
Disclaimer
This article is for informational purposes only and should not be considered financial advice. Cryptocurrency markets are highly volatile, and readers should conduct their own research before making any investment decisions.