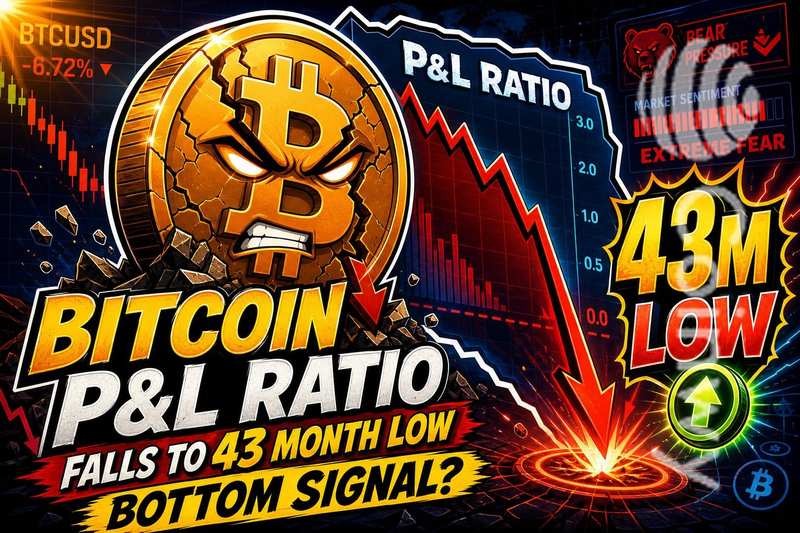
Bitcoin's realized profit-and-loss ratio has fallen to a 43-month low, reaching levels not seen since early 2022 and raising questions among on-chain analysts about whether the market is appr
Bitcoin's realized profit-and-loss ratio has fallen to a 43-month low, reaching levels not seen since early 2022 and raising questions among on-chain analysts about whether the market is approaching a cyclical bottom.
The P&L ratio measures the proportion of Bitcoin moved at a profit versus at a loss on any given day. When it drops sharply, it means a growing share of coins changing hands are being sold below their original purchase price, a sign of widespread holder stress. For related coverage, see Bitcoin steadies as Metaplanet defends options treasury.
A CryptoQuant analysis flagged the ratio's decline to its lowest reading since 2022. A 43-month lookback places the last comparable reading in early 2023, a period that preceded a prolonged recovery in Bitcoin's price.
The metric's significance lies in what it reveals about market composition. When most transactions involve losses, it suggests that remaining sellers are either capitulating or that long-term holders with higher cost bases are finally exiting positions. This type of exhaustion has historically preceded trend reversals, though the timing between signal and recovery varies considerably.
Why Depressed P&L Readings Attract Bottom Watchers
The logic behind treating extreme loss-heavy readings as contrarian signals is straightforward: when nearly everyone willing to sell at a loss has already done so, selling pressure dries up. This is the concept of seller exhaustion.
Previous cycles have shown that deeply negative sentiment and loss-dominated on-chain activity tend to cluster near market troughs. Bitcoin's miner margin squeeze adds further context to the current stress environment, as producers face their own profitability pressures alongside holders.
However, a single on-chain indicator does not confirm a bottom. The P&L ratio can remain depressed for weeks or months before a definitive reversal materializes. As CoinTelegraph reported, the 43-month low is a notable data point, but it functions as one input among many rather than a standalone trading signal.
The distinction between a bottom signal and a confirmed reversal is critical. Signals flag probability; confirmation requires follow-through in price structure and volume. Recent Bitcoin ETP outflows pushing rolling one-year flows negative suggest institutional sentiment has also weakened, adding weight to the bearish positioning the P&L ratio reflects.
What Confirmation Looks Like From Here
Traders watching for a reversal should look beyond the P&L ratio to price action itself. A sustained move above key resistance levels, accompanied by rising volume, would be the first concrete sign that seller exhaustion is translating into renewed demand.
Volatility metrics and broader sentiment readings matter as well. Periods where ETF buying meets extreme fear have historically marked inflection points, though the current cycle's dynamics may differ given evolving market structure.
The risk that deeply bearish on-chain readings persist before a full bottom forms is real. Bitcoin's P&L ratio fell to comparable levels in 2022 and stayed depressed for months before price action confirmed a floor. Patience and multi-indicator confirmation remain more reliable than acting on any single metric, however historically notable it may be.
For now, the 43-month low in Bitcoin's P&L ratio joins a growing list of stress indicators, including declining holder profitability and miner revenue compression, that paint a picture of a market under pressure but potentially approaching the kind of exhaustion that precedes recoveries.
Disclaimer: This article is for informational purposes only and does not constitute financial or investment advice. Cryptocurrency and digital asset markets carry significant risk. Always do your own research before making decisions.
Read original article on coinwy.comRead also :