Bitcoin has slipped below $56,000. The weekly candle trades at $55,729, down 14.67%, after BTC lost a rising trendline that held since the 2022 lows. The big question now is simple. Could Mic
Bitcoin has slipped below $56,000. The weekly candle trades at $55,729, down 14.67%, after BTC lost a rising trendline that held since the 2022 lows.
The big question now is simple. Could Michael Saylor's Strategy run short of cash and be forced to sell BTC to pay its STRC dividends?
Based on public filings, a sale is a choice, not an automatic trigger. But the pressure is real, and the numbers are worth a close look.
Key takeaways
BTC trades at $55,729, below all four weekly EMAs.
First support is $49,592, about 11% lower. Next is $40,412.
Strategy holds 850,849 BTC at a $75,446 average cost, a 25.91% paper loss.
STRC dividends may need roughly 21,500 BTC a year, by my own estimate.
Peter Brandt warns past bull markets all ended with drops of at least 75%.
BTC loses the trendline: what the weekly chart shows
The weekly candle opened at $65,310 and hit a low of $55,483. That is a drop of $9,583 in one week, with about a day and a half left before the close.
The rising trendline sat near $62,000. Price lost it in one move.
All four moving averages now sit above the market. The 200-week EMA is at $69,554. The 20, 50 and 100-week EMAs are at $73,655, $77,009 and $78,138.
That stack acts like a ceiling for now. Bulls need the trendline back first, then the 200 EMA.
On the downside, the first support is $49,592. Next comes $40,412. Deeper levels are $25,136 and $15,479.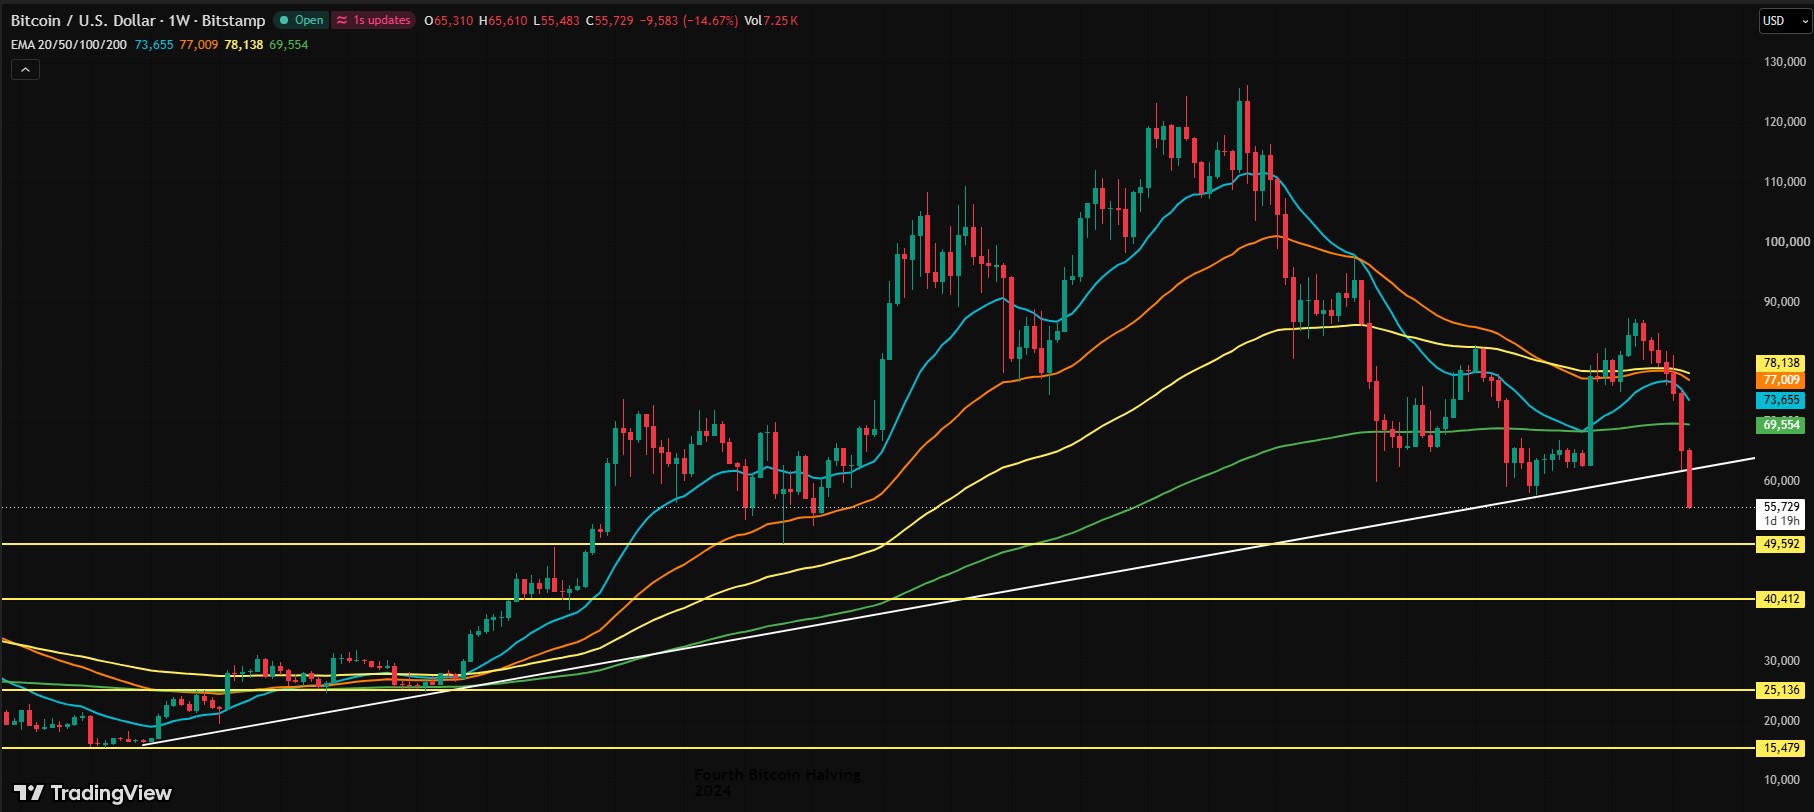
Key BTC levels to watch
Level Type
Price
Distance from $55,729
Note
Resistance
$75,446
+35.4%
Strategy average cost
Resistance
$73,655
+32.2%
20-week EMA
Resistance
$69,554
+24.8%
200-week EMA
Resistance
~$62,000
+11.3%
Broken trendline (approximate)
Current
$55,729
0%
Weekly candle, still open
Support
$49,592
-11.0%
First horizontal support
Support
$40,412
-27.5%
Second support
Support
$37,629
-32.5%
Brandt's 70% retracement level
Support
$31,550
-43.4%
75% scenario, not Brandt's stated target
Support
$25,136
-54.9%
Deep structure level
Support
$15,479
-72.2%
Extreme case
Strategy sits on a $16.69 billion paper loss
SaylorTracker shows Strategy holds 850,849 BTC across 122 purchase events. The average cost is $75,446.
At roughly $56,000 per coin, the stack is worth $47.73 billion. That is a paper loss of $16.69 billion, or 25.91%.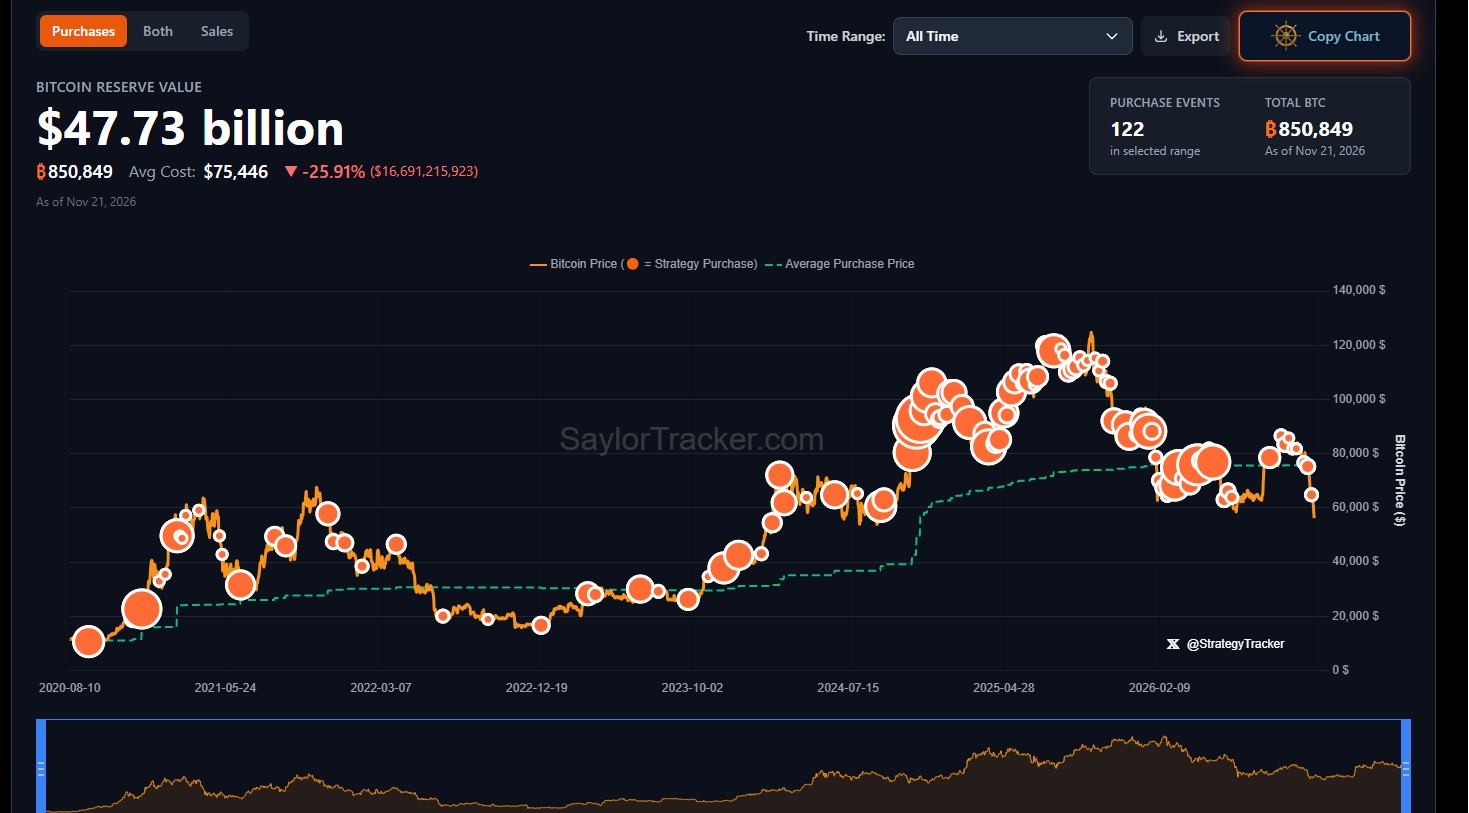
Lookonchain posted a slightly different snapshot: a $16.9 billion loss, a $75,452 cost and a $47.3 billion value.
The tracker's chart shows the biggest buys came in 2024 and 2025, between $80,000 and above $100,000. The latest buys cluster near $60,000 to $65,000.
Lookonchain also compared Strategy with Tom Lee's Bitmine. Bitmine holds 6,077,745 ETH at a cost near $3,350, worth about $9.35 billion. That is an $11 billion loss.
A paper loss only matters if coins are sold. That is the whole debate.
Could STRC dividends cause a liquidity crunch?
STRC is Strategy's variable-rate preferred stock. Its rate is 12%, and the notional value is near $10 billion, according to the company's own STRC page.
That is a big jump. The March quarterly filing showed about $5.02 billion in STRC at an 11.5% rate.
At 12% on roughly $10 billion, dividends run near $1.2 billion a year. At today's price, that is about 21,500 BTC a year, or around 1,790 a month. It equals about 2.5% of holdings. These are my estimates, not company figures.
As per report on June 29 Strategy set up a framework that allows BTC sales to fund dividends.
Still, filings say the board declares these dividends. A sale is a choice, not an automatic trigger. The company also says its preferred shares are not backed by its coins.
The pressure point is STRC itself. It has traded under its $100 par value for months and closed near $99.32 in mid-October.
In one week, Strategy spent $176 million on STRC buybacks and only $28 million on BTC. Weak STRC demand makes new fundraising harder.
Would a Strategy sale cause panic selling?
The coin count looks small next to total holdings. About 1,790 BTC a month would not be the main story.
The signal would be. Strategy has been the loudest buyer for years, and Saylor's latest post says Bitcoin is the foundation of everything the company does. He points to supply that ignores demand, zero terminal inflation and an infinite economic half-life.
A first sale, even a small one, would test that message. Some traders would sell first and ask questions later.
The community is split. Some worry about the scale of the loss. Others trust the long-term hold through volatility.
What Peter Brandt says about the downside
Veteran trader Peter Brandt is bearish. On November 15 he shared a weekly chart with a possible head-and-shoulders top. The neckline sat near $60,000 to $65,000, and price has now moved under it.
On November 20 he posted that every bull phase in Bitcoin history ended with a correction of at least 75% of the prior parabolic run. He framed it as a question, not a call.
His chart marks a 70% retracement near $37,629. Outlets that applied a 75% drop to the October 2025 peak of $126,198 got about $31,550. Brandt did not name that as a target.
He also said that if the pattern holds, BTC may never revisit its old high.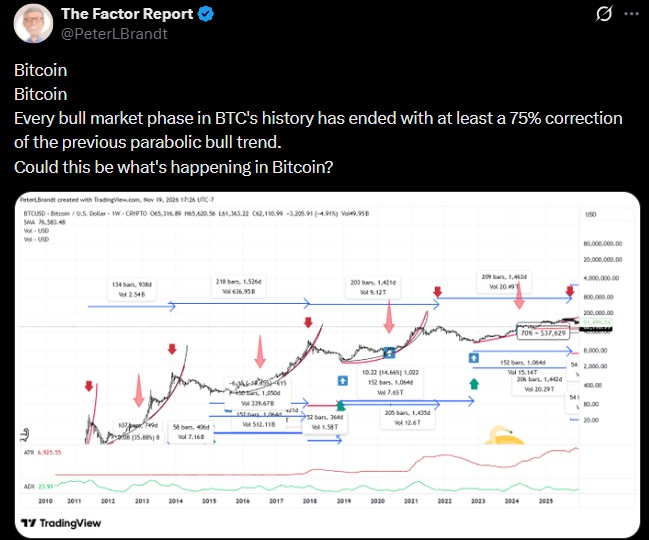
Pressure from ETFs adds to the mood. SoSoValue data showed about $582.3 million in net outflows from US spot funds on November 19, and about $3.47 billion for the month.
The Class B angle: what Ales Vavra says
Analyst Ales Vavra says Saylor has held Class B founder shares since the start and has never put in money for later capital raises.
Each time Strategy raises new money and buys BTC, he says, Saylor gets his pro-rata share for free. The raises come from Class A stock sales, preferred shares or debt.
His chart puts that share at 39,410 BTC, down from a peak of 45,897. His pie chart splits BTC added by funding source:
Class A common stock: about 63%
Convertible and secured debt: about 20%
Preferred stock: about 11.6%
Company cash: about 5.5%
His view is that other holders carry the cost. That is an opinion built on his reading of SEC filings.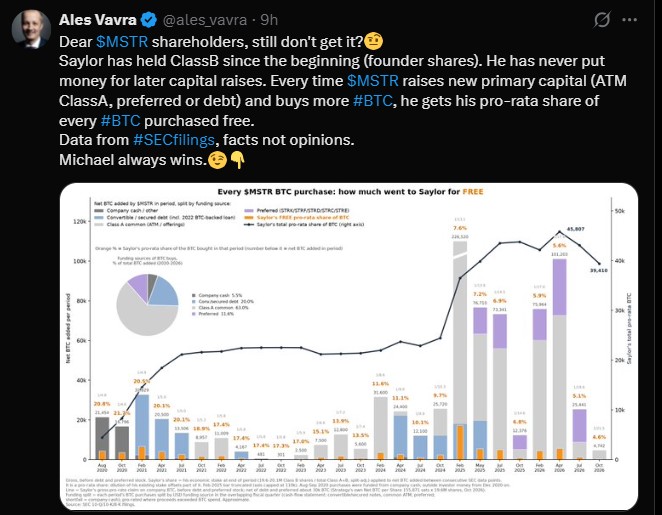
How low can Bitcoin go: $50K, $40K or lower?
Base case, $49,592. The first support is only 11% away. A test of it would not be a shock after a 14.67% weekly drop.
Bear case, $40,412 to $37,629. It would likely need more bad news, such as a Strategy sale or a weak STRC. That is 27.5% to 32.5% lower.
Deep case, $31,550 or below. This matches the 75% pattern Brandt describes. It is 43% lower and not a forecast. $25,136 and $15,479 are older chart levels.
Relief case. A move back above the trendline near $62,000, then the 200-week EMA at $69,554, would ease pressure. A return above $75,446 would put Strategy back in profit.
What to watch next
Bitcoin sits at a decision point. Watch the weekly close, STRC trading versus its $100 par, ETF flows and any new filing from Strategy.
Disclaimer
This article is for information only and is not financial, investment or trading advice. Cryptocurrency prices are highly volatile, and you can lose some or all of your money. Price levels and scenarios here are not guarantees. Do your own research and speak with a licensed financial advisor before making any decision.