Bitcoin is trading at $75,161 at the time of writing, up 2.95% on the day after opening at $73,000 and printing a session high of $75,727. That is the first time BTC has traded above $75,000
Bitcoin is trading at $75,161 at the time of writing, up 2.95% on the day after opening at $73,000 and printing a session high of $75,727. That is the first time BTC has traded above $75,000 since late May, and it caps a four-day run that has added close to 20% in a single week.
This is no longer a relief bounce inside a downtrend. It is a structural break, and the debate has shifted from whether Bitcoin can reclaim $70,000 to whether it can hold what it just took.
Why is the Bitcoin price above $75,000 right now?
$Bitcoin is above $75,000 because a bond market liquidity shift, the largest short liquidation event on record and a sharp improvement in US regulatory expectations all landed inside the same 72-hour window.
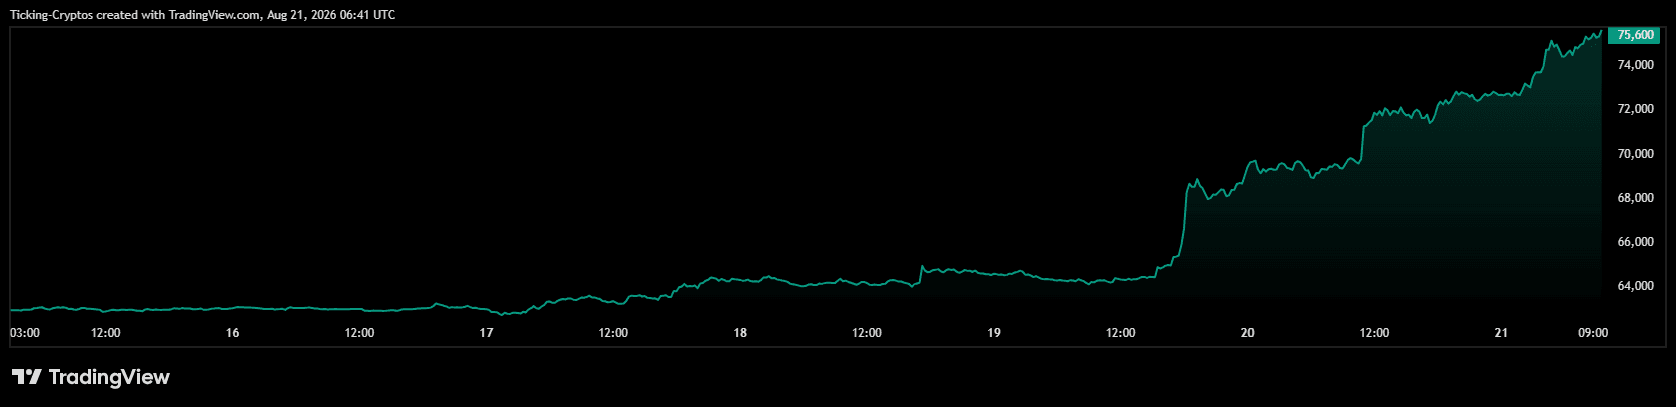
Bitcoin price in USD over the past week
The sequence matters. The trigger came from the US Treasury rather than from crypto. Once yields fell and the dollar softened, Bitcoin broke out of the $61,500 to $66,900 range that had held since June. That break forced an enormous unwind of short positions, which carried price through $70,000, then $72,000, and now $75,000 in three consecutive sessions.
The move is broad rather than Bitcoin-only. On the week, Bitcoin is up 19%, Ether 25% and XRP 28%. Bitcoin's market capitalisation stands near $1.5 trillion with just over 53% of total crypto market share, and 24-hour volume has climbed to roughly $59 billion, well above recent averages.
Sentiment has flipped with it. The Fear and Greed Index has risen to 68, firmly in greed territory.
Reason 1: How did the Treasury buyback decision drive Bitcoin higher?
The Treasury's decision to double its long-dated bond buybacks lowered long-end yields, weakened the dollar and revived the debasement trade.
The Treasury said it would double its long-term buyback operations from $2 billion to at least $4 billion per transaction, running between 9 September and 4 November, which pulled the 30-year yield down from 5.337% to around 5.20% and lowered the opportunity cost of holding non-yielding assets.
Traders have nicknamed it "QE Lite," but the more interesting read is the fiscal one. VanEck's head of digital assets research Matthew Sigel argued the price reaction is not about the CLARITY Act at all, but about the Treasury reigniting fears of fiscal dominance.
That distinction matters for anyone sizing a position here. If this is a fiscal story, it has legs beyond a single announcement. If it is purely a yield reaction, it fades when yields stabilise.
Want to trade the macro swings across crypto and indices from one account?Open an account with XTB and access CFDs on 39 cryptocurrencies with no inactivity fee.

CFDs are complex instruments and come with a high risk of losing money rapidly due to leverage. A high percentage of retail investor accounts lose money when trading CFDs. You should consider whether you understand how CFDs work and whether you can afford to take the high risk of losing your money.
Reason 2: How big was the short squeeze that fuelled the BTC rally?
Wednesday produced the largest short liquidation event in crypto history, and the forced buying has not stopped since.
CoinGlass data shows over $2.75 billion in Bitcoin shorts were liquidated on Wednesday, with a further $783.2 million in Bitcoin positions liquidated over the following 24 hours, of which $747.7 million were shorts.
That second number is the one worth watching. The initial squeeze was a one-off event. The follow-through liquidations tell you that traders kept trying to short into the move at $72,000 and $74,000, and kept getting run over.
The honest counterpoint comes from the sell side of the argument. MEXC Research chief analyst Shawn Young said "The Treasury opened a pressure valve, and crypto priced it like a regime change," adding that the bond move forced shorts out faster than it improved Bitcoin's macro case. His point is that the intensity of the squeeze reveals how one-sided positioning already was, which makes the announcement a trigger rather than a fundamental shift.
Anyone who got liquidated on either side of this will need clean records for tax season.
Reason 3: Is US crypto regulation now supporting the Bitcoin price?
Yes, and the CLARITY Act has moved from stalled to scheduled, which is a meaningful change in the regulatory outlook.
President Trump hosted executives from Coinbase, Ripple, Robinhood, Kraken and ICE at a White House meeting on 19 August and called on Congress to pass a fair version of the CLARITY Act, the bill that would determine whether most digital assets are regulated as securities or commodities. The legislation had been stalled in the Senate, and a procedural vote is now scheduled for September.
There is a second layer here that got less attention. CFTC Chairman Michael Selig said the agency is prepared to use its existing authority to build a regulatory framework for crypto markets if Congress fails to pass the CLARITY Act. In other words, the market now has a path to clarity whether or not the bill passes.
Separately, the SEC proposed rules giving crypto companies a framework to raise capital, defining two registration exemptions for crypto-related investment contracts and allowing certain crypto assets to shed securities classification once a project meets core decentralisation conditions.
New to the market and want spot exposure without leverage?Buy Bitcoin on Bitpanda and trade over 3,000 digital assets from one regulated European platform.
What does the Bitcoin chart show after the 200 EMA breakout?
Bitcoin has closed above its 200-day EMA at $71,549 and reclaimed $74,450, which flips both from resistance to support and confirms the first genuine trend change since the June breakdown.
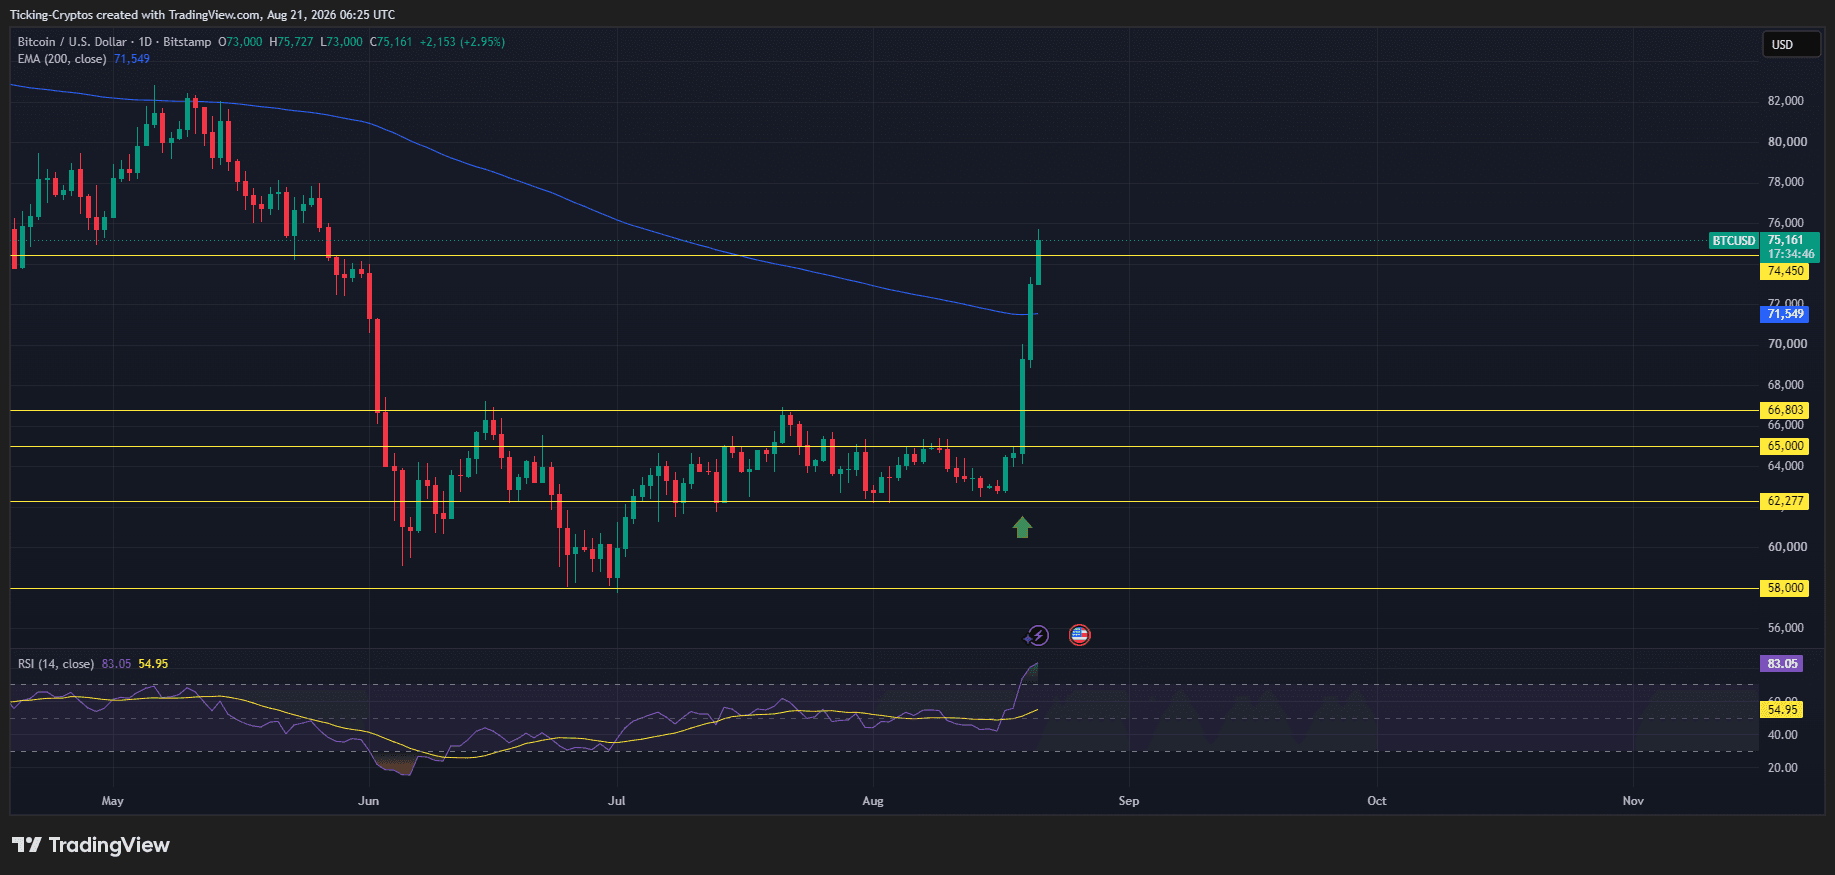
The chart looks materially different from 48 hours ago. Since June, Bitcoin was trapped between roughly $58,000 and $66,803, with $62,277 and $65,000 as the internal pivots. The rally sliced through all of them without pausing, then took out the descending 200-day EMA and finally cleared $74,450, the level that acted as the ceiling back in April.
Today's candle opened at $73,000, never traded below that open, and pushed to $75,727. A daily candle that holds its open as its low is a strong sign that dips are being bought rather than sold.
The warning sign is momentum. The daily RSI has spiked to 83.05 against a signal line at 54.95. That is one of the most extreme readings on the entire chart and it is well beyond the standard 70 threshold. Overbought conditions can persist in a genuine trend change, but a reading above 83 usually resolves through either a sharp pullback or a period of sideways consolidation. Very rarely does it resolve through more vertical gains.
Bitcoin Prediction: What is the next Bitcoin price target above $75,000?
The next target is $77,489, the 78.6% retracement of the decline from $82,850 to $57,800, and a decisive close above it opens the path back to the $82,850 swing high.
That Fibonacci level at $77,489 measures the downswing from $82,850 to $57,800, and a decisive close above it would open the path toward the $82,850 swing high. It sits roughly 3% above current price, so it is well within reach if the current pace holds even briefly.
Above $82,850 the chart is largely clean air until the $88,000 region, where the market last traded with any real volume before the spring breakdown. That is a third-stage target and not something to plan around this week.
The realistic path looks like this:
TargetDistance from $75,161What it needs$77,489+3.1%Momentum to hold through the RSI reset$82,850+10.2%A daily close above $77,489 plus continued spot demand$88,000+17.1%A full trend reversal confirmed over weeks, not days
Where does the bullish Bitcoin setup break?
The setup weakens on a daily close back below $74,450 and breaks outright below the 200-day EMA at $71,549.
The levels to watch, in order:
LevelRole$74,450Former April resistance, must now hold as support$71,549200-day EMA, the line that defines the trend$66,803Old range ceiling, the last structural defence$65,000Mid-range pivot$62,277Range low$58,000Summer low
Losing $74,450 on a daily close would not be fatal, but it would suggest the move overshot and needs to retest the EMA. Losing $71,549 would put the entire breakout back in question and would strongly favour the argument that this was a liquidation-driven spike rather than a trend change.
There is one more consideration. Bitcoin has moved from below $65,000 to above $75,000 in a matter of days. Moves that fast leave no volume shelf underneath them, which means any pullback can travel a long way quickly before finding real bids.
Bitcoin price prediction: can BTC reach $82,850?
A move to $82,850 is plausible over the coming weeks, but it depends on whether spot and ETF buyers replace the forced short covering that got Bitcoin here.
The bull case has real substance now. The 200-day EMA has been reclaimed, $74,450 has flipped, the weekly candle is the strongest in over two years, and the regulatory calendar has a concrete date in September. If the CLARITY Act clears its procedural vote, that is a catalyst the market has not yet priced.
The bear case has not gone away either. Roughly $3.5 billion in cumulative short liquidations built this rally. Once that fuel is spent, price needs organic demand at levels that were resistance a week ago. An RSI above 83 is not a level from which sustainable rallies typically extend without a pause first.
The most likely outcome sits between the two. A consolidation between $74,450 and $77,489 that works off the overbought reading would be a healthier setup than another vertical push, and it would give the $82,850 target a much firmer base to work from.
Watch the daily close against $74,450 first, and the 200-day EMA at $71,549 as the real line in the sand. Those two levels decide whether this becomes a new cycle or the sharpest bear market rally of 2026.