Bitcoin (BTC) is trading in a tight box today, and traders are watching closely for the next move. As of this writing, BTC sits near $65,050, up a modest 0.45% on the day. The bigger story is
Bitcoin (BTC) is trading in a tight box today, and traders are watching closely for the next move. As of this writing, BTC sits near $65,050, up a modest 0.45% on the day.
The bigger story is not the price itself. It is how boxed-in Bitcoin has become between two liquidation walls just a few hundred dollars apart.
This kind of range often comes right before a bigger move. But which way it breaks is still unclear.
Where Is Bitcoin's Price Right Now?
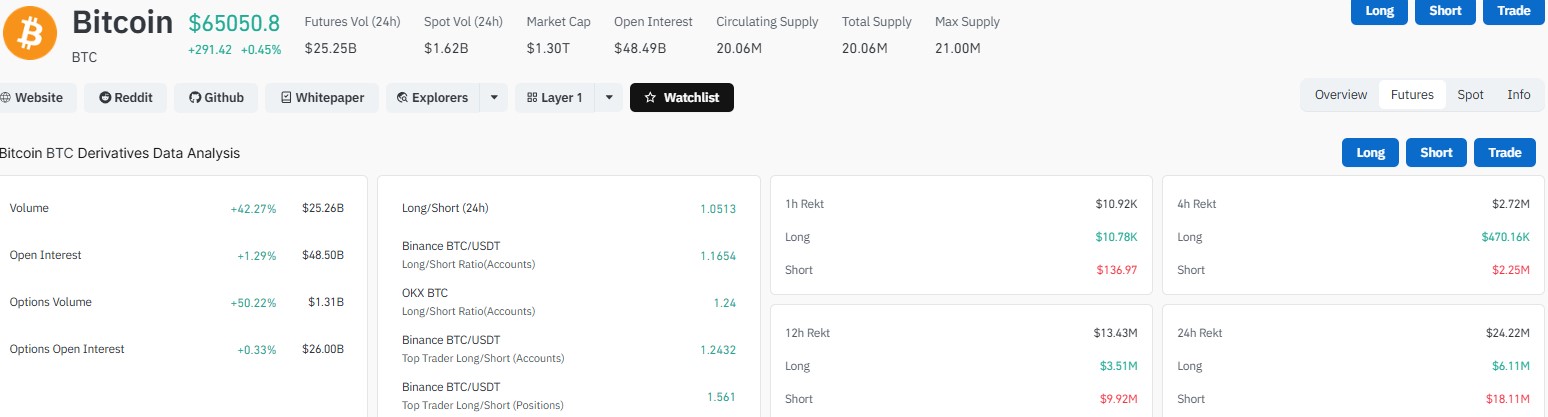
BTC price is changing hands around $65,028 to $65,050, based on the latest exchange data. In just the past hour, BTC touched a high of $65,893 and a low of $64,595. That is roughly a 2% swing in a short window, which shows the market is testing both edges of its current range.
Daily volume on spot markets sits at $1.62 billion, while futures volume is much larger at $25.25 billion.
Open interest, which tracks the total value of active futures contracts, is at $48.49 billion, up 1.29% over the past day. That tells us traders are not walking away. They are simply waiting.
Why Is Bitcoin Stuck in a Range Today?
The liquidation map explains a lot. Long liquidations, meaning positions that get force-closed if price falls, are clustered heavily around $64,600. Short liquidations, the opposite bet, are stacked up near $65,900.
Between those two zones sits a strange no man's land. Liquidation volume drops to almost nothing right around the current price of $65,061, based on the Coinglass liquidation map. That thin middle zone is why Bitcoin keeps chopping sideways instead of trending.
Once price pushes past either wall, it tends to accelerate. That is because forced liquidations add fuel in the same direction as the move.
What Do the Long and Short Ratios Show?
Traders on major exchanges are leaning slightly bullish for now. The Binance BTC/USDT long-short account ratio sits at 1.1654, while OKX shows a similar tilt at 1.24. Binance's top trader ratio is even higher at 1.561, meaning experienced traders hold more long positions than short ones.
That said, sentiment can flip fast in crypto. A ratio above 1.5 sometimes signals a crowded long trade, which can set up a sharp move lower if longs get squeezed.
Metric
Value
BTC Price
$65,050.8
24h Change
+0.45%
Market Cap
$1.30T
Open Interest
$48.49B
Binance Long/Short Ratio
1.1654
Top Trader Long/Short Ratio
1.561
Long Liquidation Zone
~$64,600
Short Liquidation Zone
~$65,900
What Does the 300-Week Moving Average Mean for Bitcoin?
Crypto trader Crypto Rover pointed to a long-term signal this week. He noted that Bitcoin has historically never bottomed above its 300-week moving average, which currently sits near $55,000.
This is a long-term trend line, not a short-term signal. It does not predict what happens this week or even this month. But some traders use it as a floor to watch during deeper pullbacks, since Bitcoin has tended to find support near or below that line during past bear phases.
It is worth noting this is one opinion from a single trader, and price does not always follow historical patterns exactly.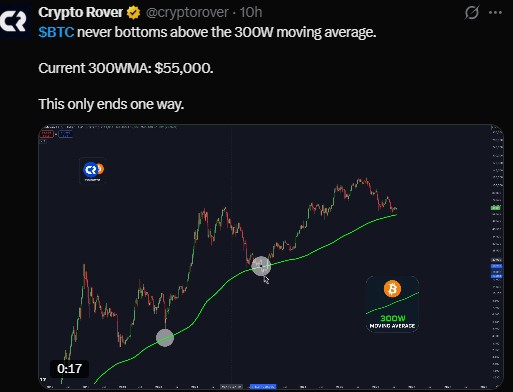
What Happened With the BIP-110 Bitcoin Fork?
Away from the charts, Bitcoin's network security got a real-world stress test. Michael Saylor, the executive chairman of Strategy, addressed a recent fork attempt called BIP-110.
According to Saylor, about 99.85% of Bitcoin's hashpower stayed with the original Bitcoin chain. The BIP-110 branch reportedly mined only two blocks and quickly fell more than 80 blocks behind the main chain.
Saylor added that at roughly 0.15% of total hashpower, the fork would need to mine 2,015 more blocks before its first difficulty adjustment. At current mining speeds, he estimated that would take about 25 years.
His point was simple. Anyone can technically fork Bitcoin's code. But without miners, users, and capital backing it, a fork does not carry real economic weight. Consensus, he said, is earned rather than declared.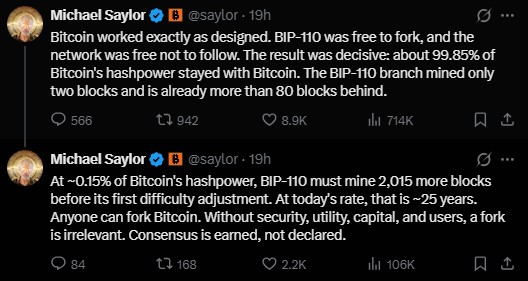
Is Michael Saylor Still Buying Bitcoin?
Yes. Saylor posted an update this week captioned simply "Doing Business," showing Strategy's BTC holdings now worth $54.66 billion at current prices.
The chart shared alongside the post shows the company has made 1,842,138 purchase events across its buying history, with an average cost basis of roughly $75,003 per coin.
That average cost sits well above the current BTC price, meaning the position is showing a paper loss of around 14.21% based on the chart's own figures.
Strategy has continued dollar-cost averaging into Bitcoin through multiple market cycles, regardless of short-term price swings. Whether this steady buying continues to support the market longer term remains an open question.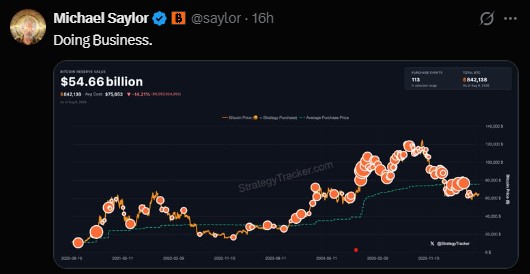
Bitcoin Price Prediction: What Comes Next?
For now, Bitcoin price action looks like a coiled spring. The $64,600 to $65,900 range has held for the short term, but thin liquidity in the middle of that zone means a breakout could move fast once it starts.
A clean break above $65,900 could trigger a wave of short liquidations, adding upward pressure. A drop below $64,600 could do the same in reverse, pulling price toward the next support levels.
Longer-term holders may keep watching the 300-week moving average near $55,000 as a reference point, while short-term traders are more focused on the immediate liquidation walls.
No one can say for certain which way BTC breaks next. The setup simply shows a market waiting for a spark.
Disclaimer
This article is for informational purposes only and does not constitute financial, investment, or trading advice. Cryptocurrency markets are highly volatile and involve significant risk, including the potential loss of principal. Past performance, including historical patterns like moving averages, does not guarantee future results. Always conduct your own research and consult a licensed financial advisor before making investment decisions.