Bitcoin delivered one of crypto’s strongest sessions of 2026, climbing 5.71% to $68,380 after reaching $69,749, as the total crypto market cap jumped above $2.32 trillion. Ethereum added 9%,
Bitcoin delivered one of crypto’s strongest sessions of 2026, climbing 5.71% to $68,380 after reaching $69,749, as the total crypto market cap jumped above $2.32 trillion. Ethereum added 9%, showing that the rally extended beyond BTC.
The main catalyst was the U.S. Treasury’s decision to at least double long-term bond buybacks from $2 billion to $4 billion per operation, sending the 30-year Treasury yield from 5.337% to 5.18%. Lower yields improved the appeal of scarce assets such as Bitcoin.
The move was then amplified by a historic short squeeze, with more than $1.9 billion in crypto positions liquidated in 24 hours, including $1.74 billion in shorts. U.S. spot Bitcoin ETFs also recorded $189.3 million in daily inflows, adding institutional demand.
Why Did Crypto and Bitcoin Pump?
The Bitcoin price received support from three major forces. First, the Treasury buyback announcement changed the bond-market backdrop. Treasury plans to increase buybacks in the 10–30-year sector from $2 billion to at least $4 billion per operation beginning September 9.
The 30-year yield fell from 5.337% to 5.18% after the announcement, making the move especially important for markets sensitive to borrowing costs.
Second, leverage amplified the initial move. More than $1.9 billion in crypto positions were liquidated within 24 hours, with shorts accounting for $1.74 billion. Forced buying from short liquidations helped push the BTC price above $68,000.
Third, institutional demand improved. Spot Bitcoin ETFs recorded $189.3 million in net inflows, led by BlackRock’s IBIT with $223.1 million. The regulatory backdrop also improved after a closed-door White House meeting involving President Trump, crypto executives and regulators focused on the CLARITY Act and tokenization.
The rally was broad. Bitcoin dominance reached 59.35%, the Fear & Greed Index moved to Neutral at 53, and major crypto narratives such as the U.S. Strategic Crypto Reserve and SEC/CFTC Digital Commodities rose more than 6.6%.
What Is the Bitcoin Price Chart Showing?
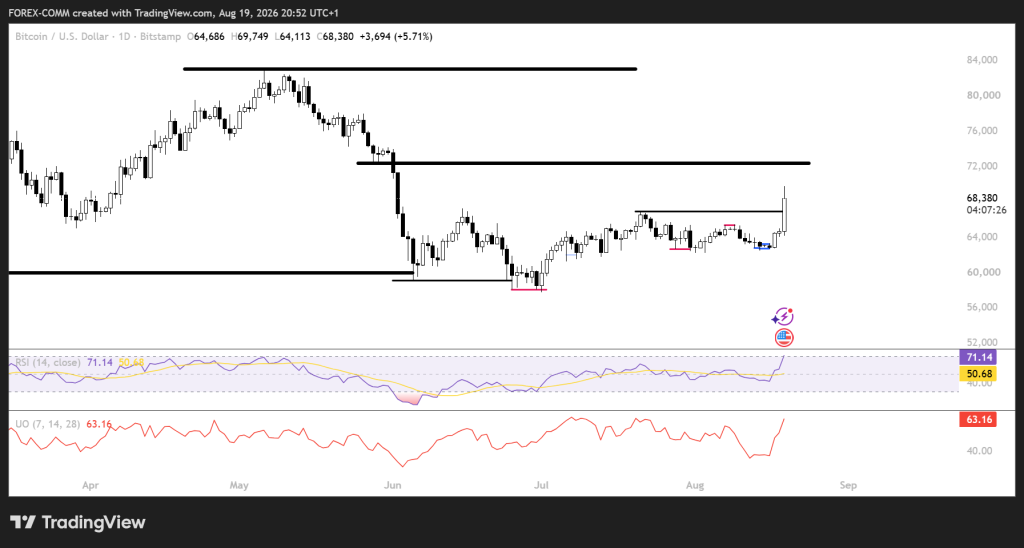
We had a look at the chart, and the technical picture has changed after BTC broke out of its recent $63,000–$66,000 trading range.
The daily candle closed at $68,380 after opening around $64,686 and reaching $69,749. That is a 5.71% daily gain and places BTC above the local resistance near $67,000. The next major resistance is around $72,200, followed by the $82,000–$83,000 region marked on the chart.
 Source: Tradingview.com
Momentum has also improved rapidly. RSI jumped to 71.14, above its 50.68 signal average and above the 70 overbought threshold.
This confirms strong buying pressure but also raises the probability of a short-term consolidation. The Ultimate Oscillator stands at 63.16, supporting the bullish setup without reaching an extreme reading.
For support, $66,000 is the first area to defend, followed by roughly $64,000. The larger support zone is around $59,500–$60,000, which held during the June and July declines.
Read Also: Pump.fun (PUMP) Price Jumps 20% as Analyst’s Prediction Plays Out, Here’s the Key Target
Where Will the Bitcoin Price Go on August 20?
For Bitcoin, the bullish path is simple: hold above $67,000 and take out $69,749. If buyers push through that level, $72,200 comes next. Keep that going, and $76,000 is in play.
The base path is consolidation. After that big daily move, the Bitcoin price could just hang out between $66,000 and $69,750. As long as $66,000 holds, the breakout setup stays alive. Then it’s another run at $70,000.
The bearish path starts with losing $66,000. If that goes, $64,000 is next. Break that, and $60,000 becomes the target. One thing worth watching: RSI is above 70. That’s overbought territory. Add in the $1.74 billion in short liquidations, and there’s real pullback risk here.
Frequently Asked Questions
Why is the Bitcoin price rising today
The Bitcoin price is benefiting from the U.S. Treasury doubling long-term bond buybacks to at least $4 billion per operation, falling Treasury yields, $189.3 million in spot Bitcoin ETF inflows, and a $1.74 billion short squeeze.
What is the next resistance for BitcoinBitcoin is facing immediate resistance around $69,750. A break above this level could open the way toward $72,200, followed by the $76,000 region.
Could Bitcoin fall after today’s rallyYes. The Bitcoin price RSI has reached 71.14, entering overbought territory. If BTC fails to hold $66,000, the next support levels are around $64,000 and $60,000.
Subscribe to our YouTube channel for daily crypto updates, market insights, and expert analysis.
The post Bitcoin Price Prediction for Today (August 20) appeared first on CaptainAltcoin.