The Bitcoin price prediction starts with a tense market. BTC trades near $64,477 on Wednesday, down 0.67% in 24 hours. The daily range sits between $63,300.9 and $65,425. $BTC slipped to $62K
The Bitcoin price prediction starts with a tense market. BTC trades near $64,477 on Wednesday, down 0.67% in 24 hours. The daily range sits between $63,300.9 and $65,425.
$BTC slipped to $62K earlier this week, and traders are nervous. The Fear and Greed Index reads 11, which means extreme fear.
The coin is now 48.9% below its all-time high of $126,198.1. So, is a bottom close, or is more pain ahead?
Why Is Everyone Calling This Capitulation?
Glassnode says BTC fell to $62K this week and capitulation is underway. Realized losses are at a level seen only near past lows.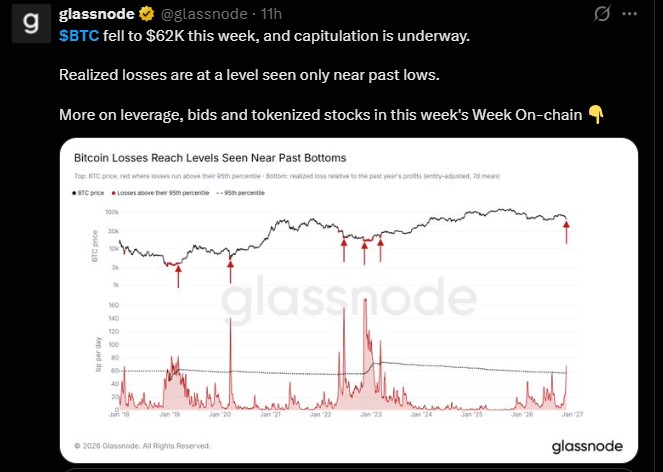
CryptoQuant adds that traders are down 20% on average, the deepest since July. Bull-market corrections usually bottom near 12% down. This one is past that mark.
The same firm says bottoms form at these levels, but they take at least two months. Demand is also still negative, even after a small recovery from its peak.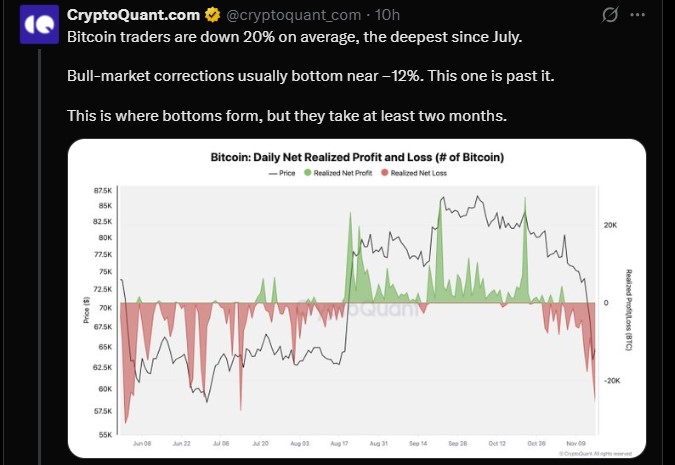
Miner Dumps and Schiff's Warning: Who Is Still Selling?
Lookonchain data shows MARA Holdings moved another 366 BTC, worth $23.33M, out of its wallets about eight hours ago.
By official disclosures, MARA sold 40,581 BTC ($3.03B) in 2026 at an average price of $74,446. That is well above today's price.
Peter Schiff expects selling pressure on MSTR, STRC and BTC to grow in the coming days and weeks. He asks if Strategy will keep buying back STRC until cash runs out, or start selling BTC instead.
ETF Outflows and Liquidations: Are Bulls Running Out of Fuel?
US spot Bitcoin ETFs recorded a net outflow of $30.40M in the latest SoSoValue data. Grayscale's GBTC led with $17.74M out, followed by ARKB at $13.12M and BRRR at $3.60M.
There was some buying. Grayscale's BTC took in $1.13M, and Morgan Stanley's MSBT added $2.93M.
Total ETF net assets stand at $83.76B, or 2.31% of BTC's market cap. Cumulative net inflows are still $54.61B.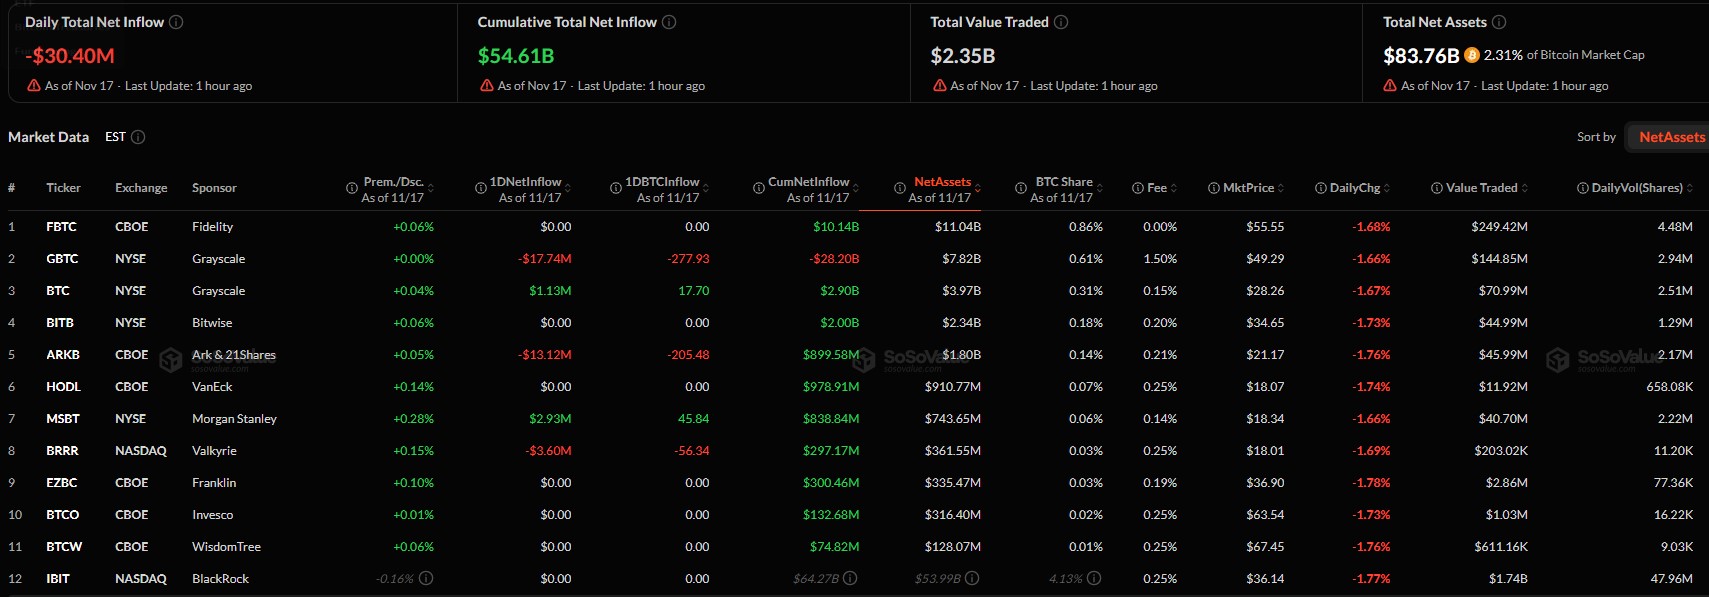
In futures, open interest fell 1.58% to $41.79B. The funding rate is slightly positive at 0.0040%.
Liquidations reached $128.84M in 24 hours. Longs lost $78.63M and shorts lost $50.21M.
On the macro side, US retail sales rose to $748.2B in October, up 6.8% from a year ago. Strong spending has not lifted crypto yet.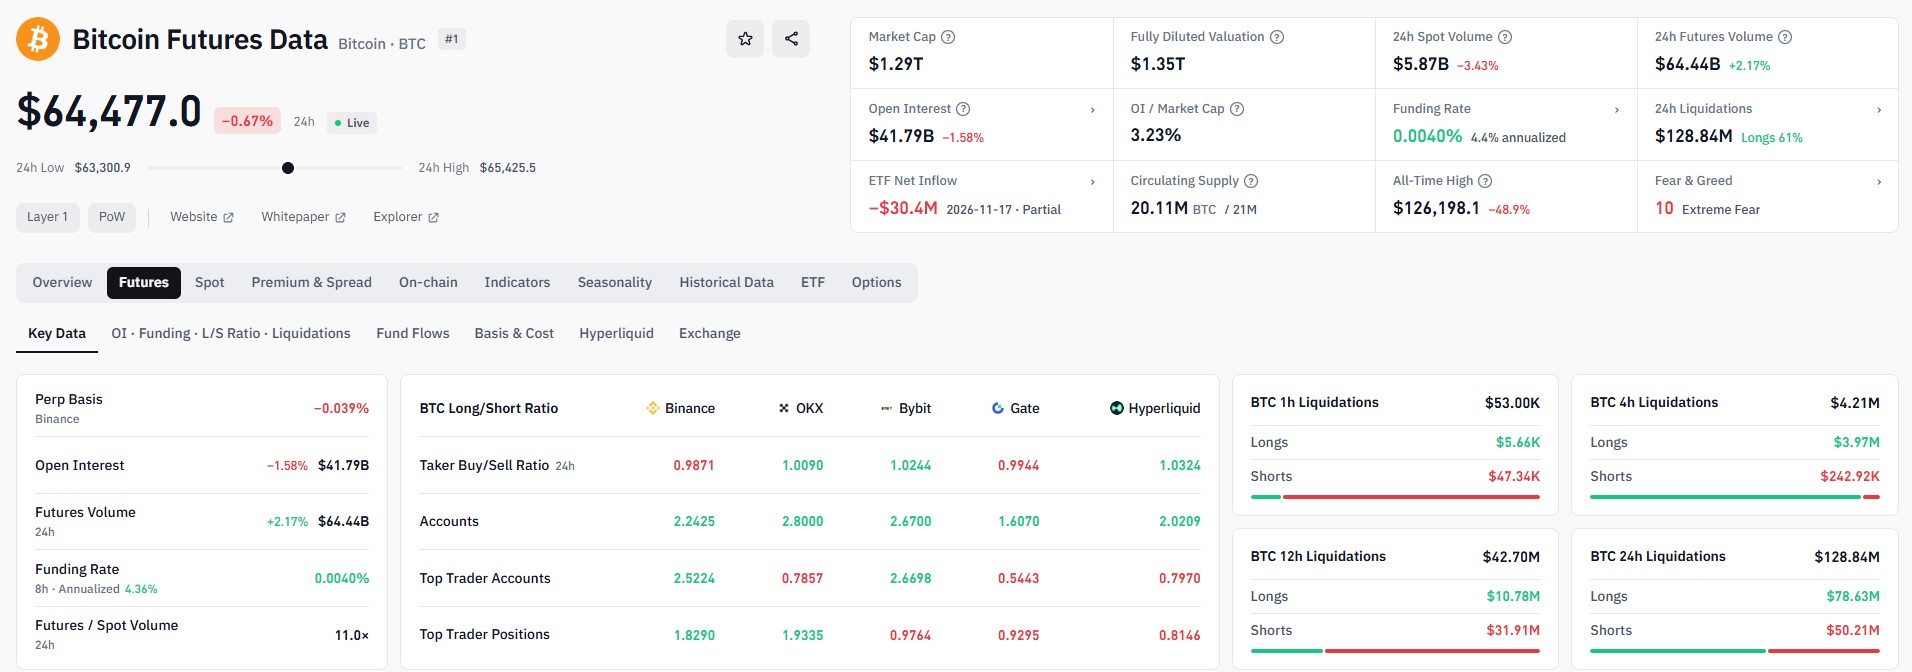
Bitcoin Price Prediction: Can the $60K Trendline Survive?
On the weekly chart, Bitcoin was rejected near the $85,000 to $87,000 zone. It has since dropped below the 20, 50, 100 and 200 EMAs.
The 20-week EMA is at $74,485, the 50 at $77,350, the 100 at $78,311 and the 200 at $69,641. RSI sits at 37.90, close to oversold.
Price is now testing an ascending trendline near $62,000 to $60,000. This zone matters most right now.
Key Level
Price (USD)
Why Traders Watch It
Support 1
$62,000 to $60,000
Ascending weekly trendline
Support 2
$58,000
First target if the trendline breaks
Support 3
$55,000 to $52,000
Deeper downside zone
Resistance 1
$69,600
Near the 200-week EMA at $69,641
Resistance 2
$74,500
Near the 20-week EMA at $74,485
Resistance 3
$78,300
Near the 100-week EMA at $78,311
Bearish case: A weekly close below the trendline could send price toward $58,000. After that, the $55,000 to $52,000 area comes into view.
Bullish case: If buyers defend the line and BTC reclaims $69,600, a relief rally toward $74,500 to $78,300 is possible.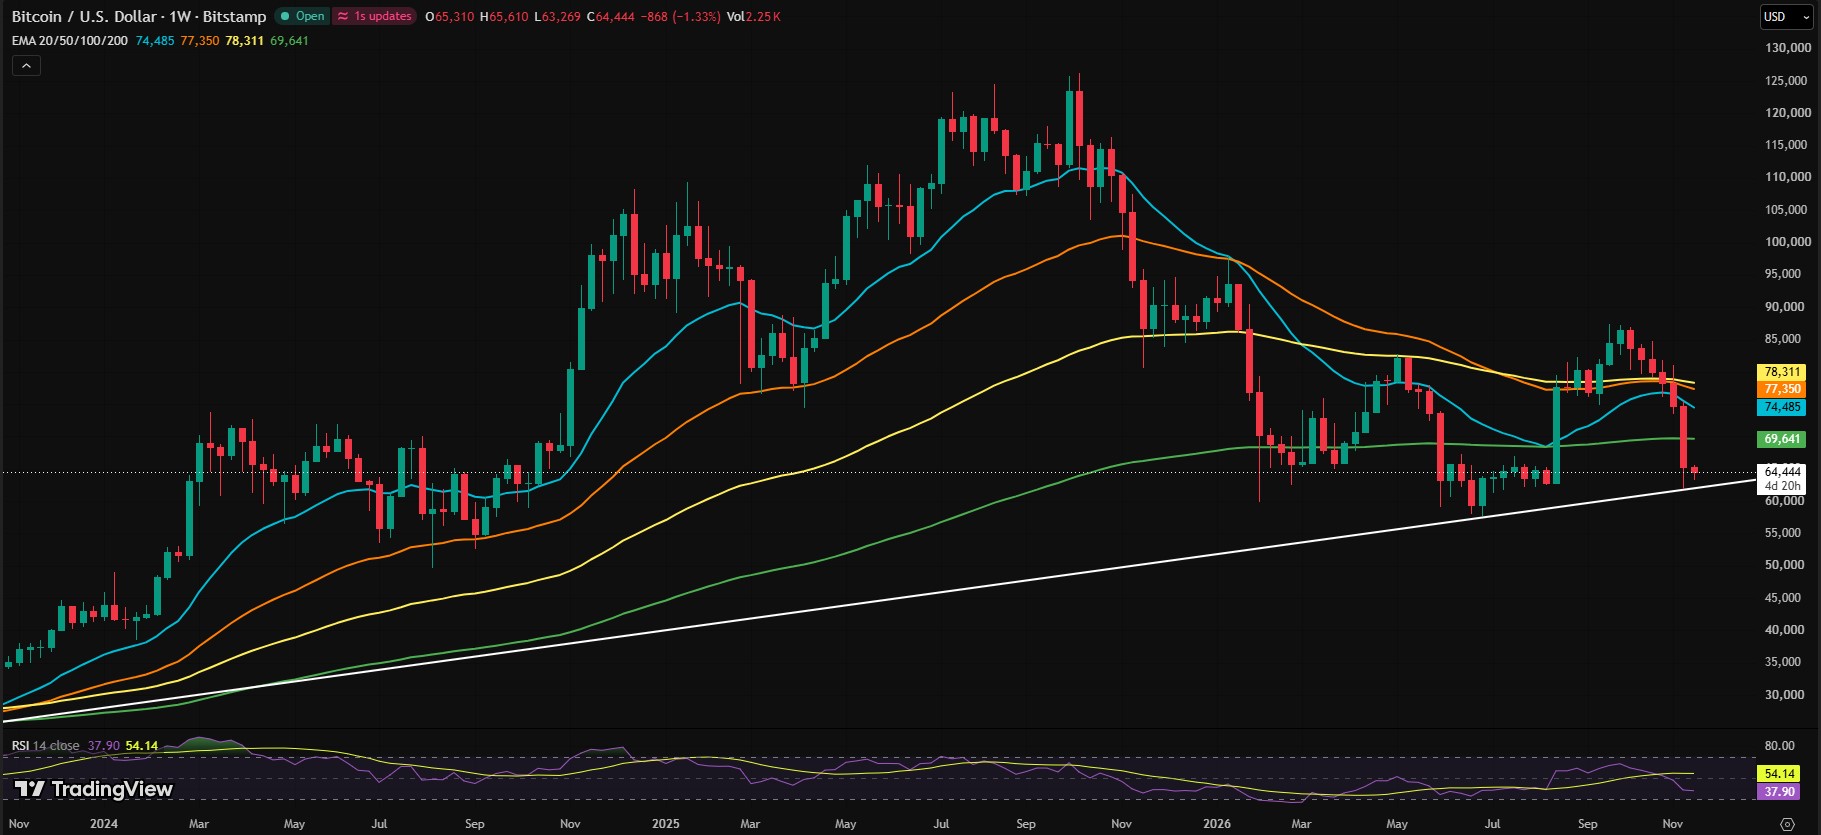
What Happens Next? Two Paths for BTC
The short-term view stays bearish. Momentum is weak, and $60,000 is the level to watch.
Nobody can call the exact low. A bounce can happen at any time, especially with sentiment this stretched.
Still, ETF outflows, miner sales and soft demand all weigh on Bitcoin. A real recovery will likely need time.
Disclaimer
This article is for information only and is not financial advice. Cryptocurrency prices are volatile, and you can lose some or all of your money. Do your own research and speak with a licensed financial advisor before making any investment decision.