Bitcoin price is having its best days of 2026. In a matter of days, the BTC price has pumped from roughly $62,000 to over $75,000; a nearly 20% move. The crypto community is super excited now
Bitcoin price is having its best days of 2026. In a matter of days, the BTC price has pumped from roughly $62,000 to over $75,000; a nearly 20% move. The crypto community is super excited now, with a lot of “bull run is starting” tweets and messages floating around.
But I would like to do a Bitcoin price reality check today and ask a simple question: are we really in the bull run?
CryptoCon and Ash Crypto are two analysts who basically say: not yet.
CryptoCon: The Halving Cycle Says the Bottom Window Starts in November
CryptoCon’s entire thesis rests on the Bitcoin halving cycle continuing to behave similarly to previous four-year cycles. The chart divides Bitcoin’s history into repeating phases, with colored dots and a sinusoidal curve at the bottom acting as a cycle clock.
The vertical dashed lines around November 2013, November 2017, November 2021, and November 2025 represent roughly equivalent points in successive cycles. The historical bottoms then appeared approximately one year later:
- January 2015
- December 2018
- November 2022
- Projected: November 2026 – January 2027
That is the central argument. CryptoCon believes Bitcoin’s latest cycle peak occurred in the expected late-2025 window. Therefore, if the four-year rhythm continues, the subsequent bear-market bottom should not arrive until approximately November 2026 through January 2027.
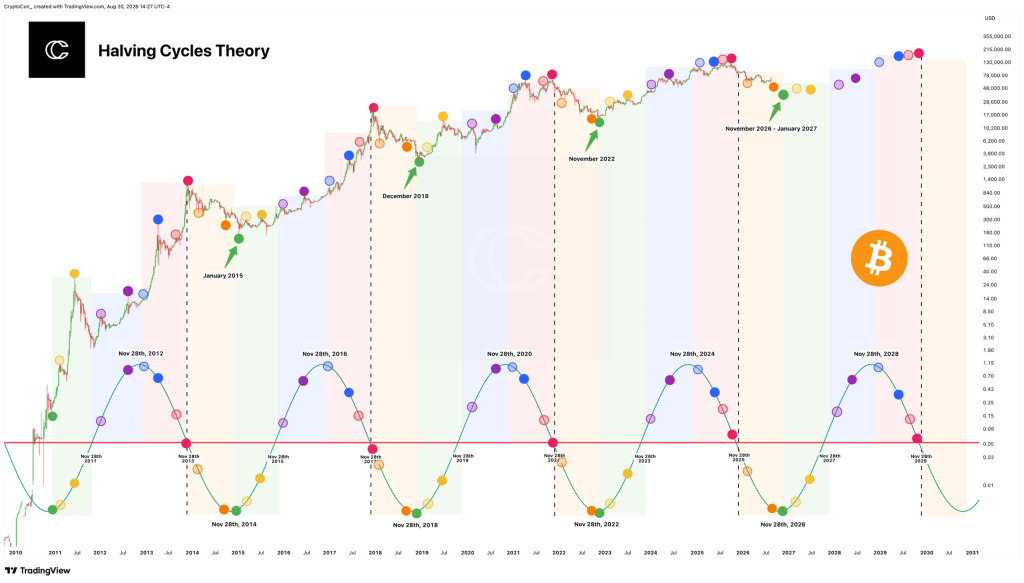 Source: X/@CryptoCon_
This is probably the most important element of his view. Bitcoin has made a substantial recovery and moved back above $70,000. Under ordinary circumstances, that can easily create the impression that the bottom is in, the bear market is over, and a new bull phase has started. CryptoCon explicitly rejects that conclusion.
He says: “The recent move over 70k does not change my view that the bear market is incomplete.”
He also notes that the present setup looks “strikingly similar to November 2022 before the cycle bottom.” His current sequence appears to be: February 2026 → first apparent bottom, June 2026 → second apparent bottom, November 2026 onward → actual cycle-bottom window. So his thesis allows Bitcoin to repeatedly convince traders that the worst is over.
CryptoCon acknowledges that “there is a lot of data that has reached cycle bottom levels or even created bullish divergence.” But his argument is that the halving-cycle timing has historically been more reliable than any individual bottom indicator. That is why he says the cycle is “good at hiding in plain sight.”
Read also: White House Crypto Summit: Trump Drops Major Bitcoin and CLARITY Act Statements
Ash Crypto: The 2022 Warning and the $67K Line
Ash Crypto is actually more balanced than CryptoCon. He explicitly says Bitcoin has produced the first genuine reversal evidence. His argument is: short-term bullish reversal = YES, but confirmed macro trend reversal = NOT YET.
Ash notes that Bitcoin has gained approximately 15% in four days and describes short-term momentum as “ultra-bullish.” He identifies several reasons why the current rally deserves to be taken seriously:
- Bitcoin reclaiming its 200-week moving average – an important long-term technical level that signals sellers are losing control.
- A bullish RSI divergence – price is still weak, but downside momentum is weakening.
- A bullish MACD crossover – momentum is turning upward.
He also sees the macro environment becoming supportive: core inflation at five-year lows and ISM at a four-year high. He also mentions the Russell 2000 hitting new highs, which has historically been a leading indicator for speculative and risk assets.
But then comes the warning.
Ash points specifically to July–August 2022. Bitcoin rallied approximately +40% , and several indicators looked similarly constructive. That recovery created the impression that Bitcoin might have established its bear-market bottom. But it hadn’t. Bitcoin subsequently suffered another major selloff, culminating in the November 2022 capitulation associated with the FTX collapse.
A technically convincing bear-market rally can still fail.
Ash gives a clear threshold: $67,000. If BTC holds above $67K, the recovery remains intact. If BTC loses $67K, the breakout increasingly looks like a fakeout. That is his make-or-break level.
Where They Agree – and Where They Don’t
Despite approaching Bitcoin completely differently, CryptoCon and Ash Crypto arrive at a surprisingly similar conclusion.
CryptoConAsh Crypto
MethodHalving-cycle timingTechnical indicators + macro + historical analogues
Core viewBear market is incomplete. Bottom window starts in November.Short-term bullish, but losing $67K exposes fakeout risk.
Bearish triggerCalendar (November)Price (losing $67K)
Both essentially conclude: the current rally is bullish, but it is too early to confidently declare the bear market finished.
The difference is that CryptoCon is considerably more bearish. His position appears relatively firm: the bear market is incomplete. Bitcoin trading above $70K has not changed that. He expects the real bottoming window later this year.
Ash Crypto is more conditional. He acknowledges that something meaningful has changed – reclaiming the 200-week MA, RSI divergence, MACD crossover, supportive macro conditions. He appears open to the possibility that the recovery continues. He just is not prepared to declare victory yet. His line in the sand is $67K.
What This Means for Bitcoin Price
The two analysts are essentially warning about the same danger: Bitcoin price today can look extremely bullish before making its final bear-market low. That is exactly what happened during parts of 2022. There were powerful rallies, improving momentum, bottom calls, bullish divergences, and eventually another capitulation.
CryptoCon believes something structurally similar could happen again. Ash Crypto does not necessarily predict that it will happen, but he believes the historical precedent is strong enough that traders should not ignore the possibility.
Bullish scenario: Bitcoin’s 15% rally represents the beginning of a genuine reversal. BTC holds above $67K, maintains the reclaimed long-term moving average, RSI and MACD continue improving, macro conditions remain favorable, and risk appetite continues expanding. In that case, CryptoCon’s historical cycle model may simply be failing to account for a cycle that has structurally changed.
Bearish scenario: The rally is another convincing bear-market recovery. BTC eventually loses $67K, momentum deteriorates, and the market enters another corrective phase during Q4. That would fit CryptoCon’s expectation that the actual cycle-bottom window does not begin until approximately November 2026, while also resembling the type of failed recovery Ash highlights from 2022.
My Take on Bitcoin Price Action
Bitcoin has finally produced some of the strongest bullish evidence seen during the current downturn. It has surged roughly 15% in four days, reclaimed an important long-term moving average, and generated bullish momentum signals. Yet two widely followed analysts are warning that those developments may still be insufficient to declare the bear market over.
CryptoCon’s halving-cycle model indicates Bitcoin’s true bottoming window does not begin until November, while Ash Crypto argues that BTC must hold above $67,000 to avoid repeating the type of convincing bear-market rally that preceded the final 2022 lows.
The contradiction is simple: Bitcoin suddenly looks bullish (perhaps genuinely bullish) but history and the halving cycle indicate that may be exactly what makes this moment dangerous. The $67,000 level is the line in the sand. The November window is the calendar to watch.
I am not buying the “bull run is starting” narrative just yet. The rally is real, but the confirmation is still missing.
Subscribe to our YouTube channel for daily crypto updates, market insights, and expert analysis.
The post Bitcoin Price Reality Check: This BTC Rally May Be Fooling the Crypto Market appeared first on CaptainAltcoin.