Bitcoin price has slipped below $64,000 as renewed US-Iran tensions, volatile oil prices, and a technology-sector sell-off tied to China’s Kimi K3 launch drove investors away from risk assets
Bitcoin price has slipped below $64,000 as renewed US-Iran tensions, volatile oil prices, and a technology-sector sell-off tied to China’s Kimi K3 launch drove investors away from risk assets.
Summary
- Bitcoin price fell below $64,000 as Middle East tensions and Kimi K3 rattled risk markets.
- BTC must reclaim $65,047 to confirm a sustained recovery toward $67,000.
- A break below $62,708 could expose the $60,000 support and trigger further liquidations.
According to data from crypto.news, Bitcoin (BTC) price fell nearly 2% to $63,785 on Monday before recovering toward $64,000, still down about 1% over the past 24 hours. The Crypto Fear & Greed Index remained in “Fear” territory at 29, while Ether, XRP, BNB, and Dogecoin also posted slight daily losses.
Middle East risks intensified after a projectile set a vessel ablaze in the Strait of Hormuz, forcing its crew to abandon ship before a tugboat rescued them. US strikes also killed one person in Tabriz, while Tehran condemned attacks on the unfinished Darkhovin nuclear facility.
CENTCOM separately reported that a US service member died during the controlled detonation of an unexploded Iranian drone in northern Iraq.
You might also like: Zcash sets July 28 hard fork to seal Orchard after critical bug
The attacks initially drove crude oil higher as traders assessed the threat to Middle Eastern production and shipping. Brent briefly exceeded $85 per barrel before falling toward $82 after Iran’s Foreign Ministry confirmed that international mediators had submitted proposals to reduce tensions.
Tehran also left the door open to negotiations with Washington if talks served Iran’s national interests. The diplomatic opening reduced immediate supply fears, although attacks on vessels, Iranian cities, and nuclear infrastructure kept the risk of another oil-price surge in place.
Technology stocks added another source of pressure after Beijing-based Moonshot AI released Kimi K3, a 2.8 trillion-parameter model designed for coding and agent-based tasks. Moonshot’s internal tests placed Kimi K3 ahead of several Western rivals in frontend coding, although those performance claims await independent confirmation when the model weights become available.
The launch intensified concerns that cheaper Chinese models could disrupt US artificial intelligence companies and their semiconductor suppliers. Bitcoin has traded closely with technology-heavy equity indices during recent risk-off sessions, leaving the cryptocurrency exposed as investors reduced positions across speculative markets.
US equity funds recorded $4.8 billion in withdrawals during the week ended July 15, according to LSEG Lipper data cited by Reuters. The Philadelphia Semiconductor Index lost 8.48% during the same period, while growth funds suffered $7.18 billion in net redemptions.
Bitcoin price must reclaim $65,000 to confirm a sustained recovery
Bitcoin’s daily chart shows repeated failures around $65,047, a former support level that has turned into resistance. Buyers have tested the barrier several times since early July, but each attempt has ended without a daily close above it.
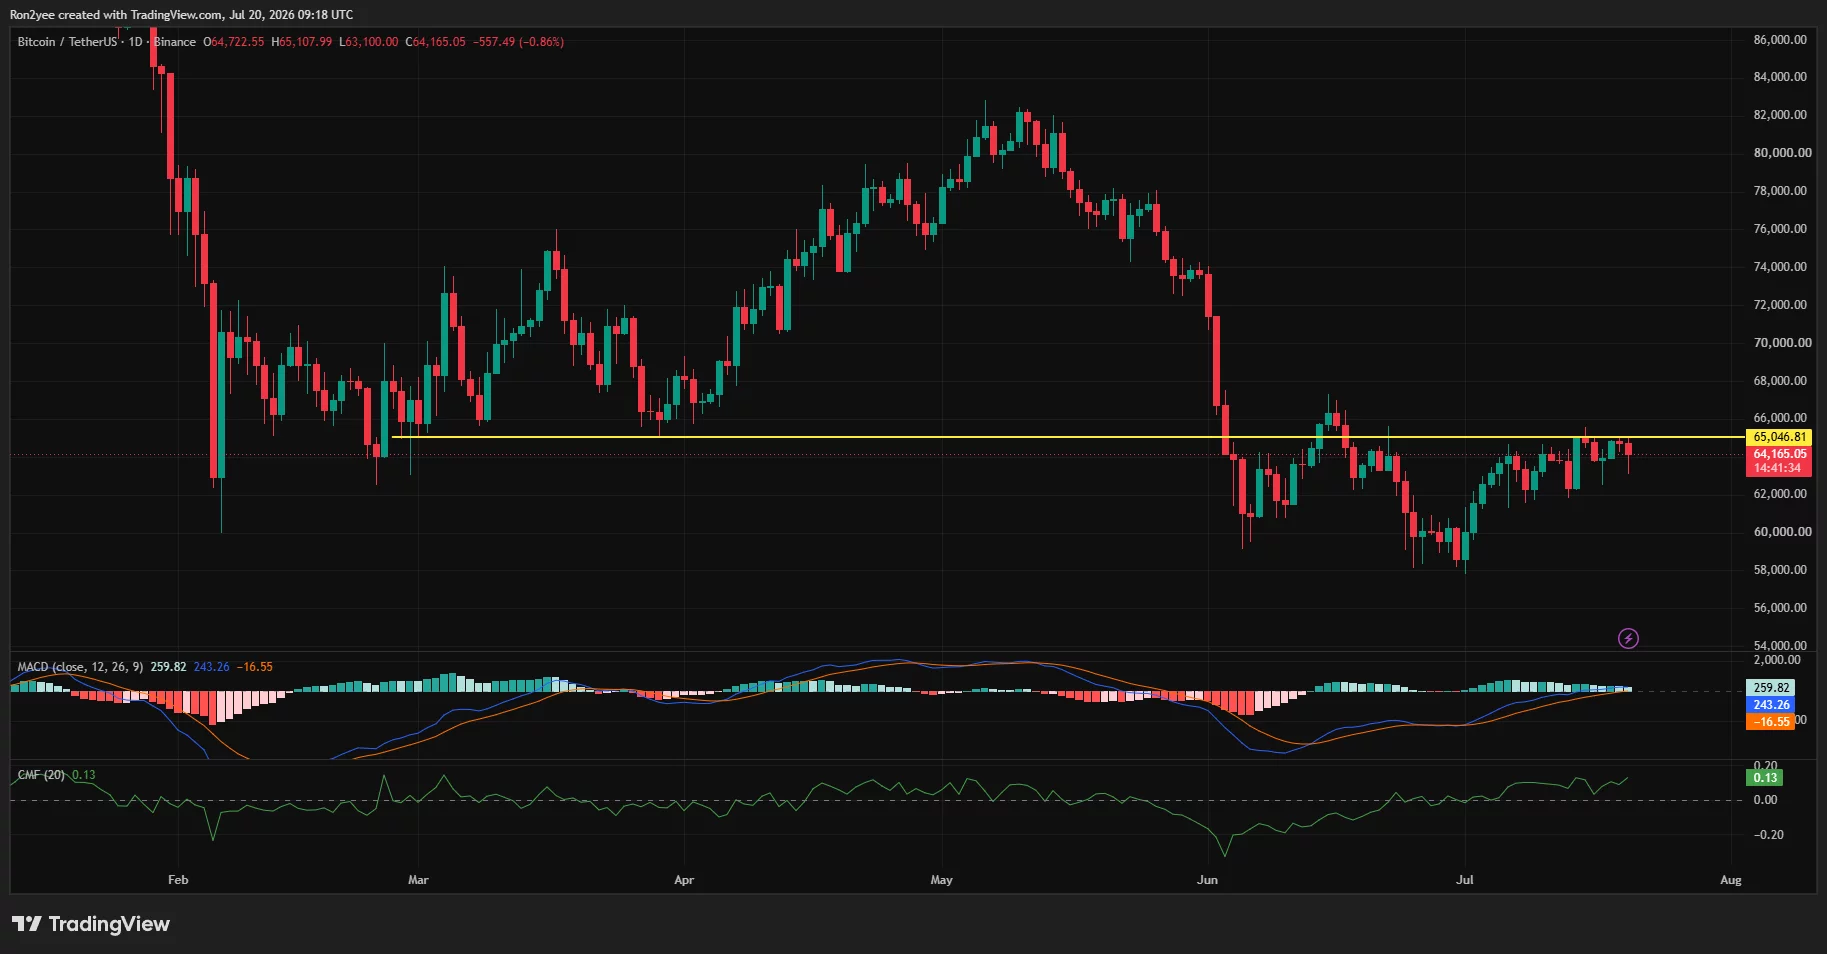
Bitcoin price daily chart — July 20 | Source:
crypto.newsA decisive close over $65,047 would restore the recovery structure and expose the June swing high near $67,000. Until then, Bitcoin remains inside the range between roughly $60,000 and $65,000 that has controlled price action for most of July.
On the 4-hour chart, BTC has fallen below its 20-period simple moving average at $64,206 but remains close to the 50-period average at $64,024. The 100-period SMA at $63,642 offers the next support, followed by the 200-period SMA near $62,708.
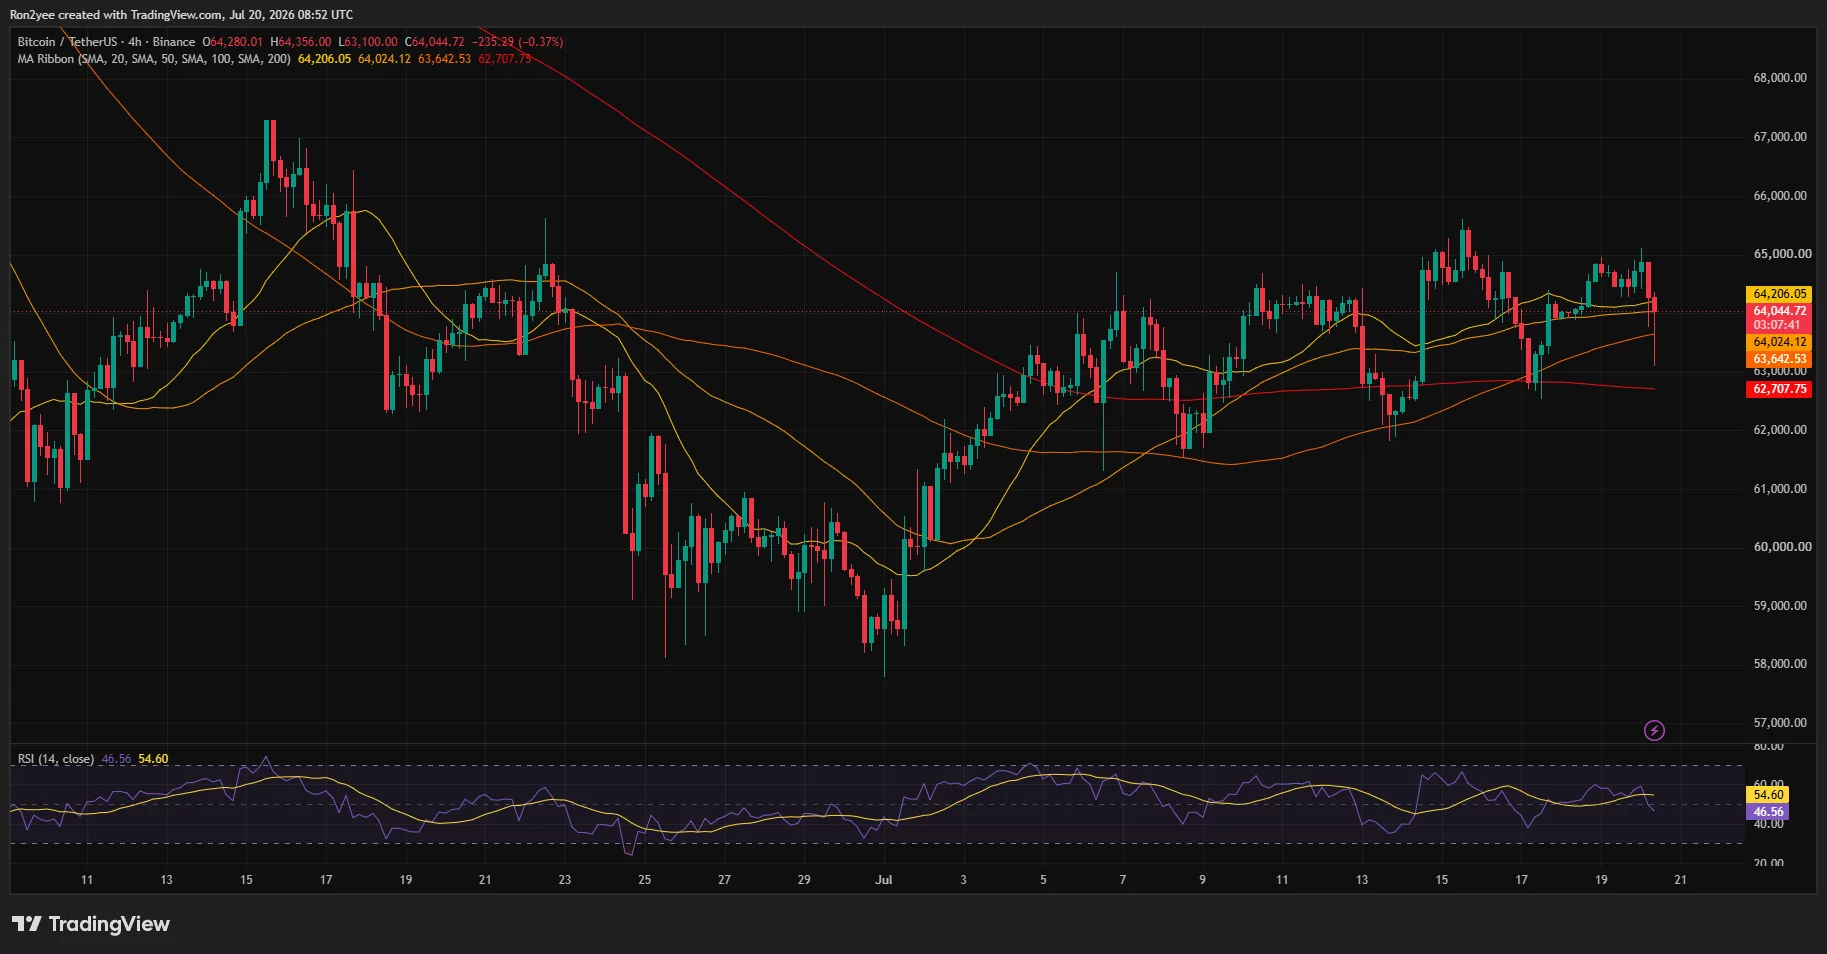
Bitcoin price 4-hour chart — July 20 | Source:
crypto.news4-hour relative strength has dropped to 46.56, below its moving average of 54.60. The reading shows that sellers have regained control of short-term momentum, though BTC has not yet entered oversold territory.
Daily momentum presents a mixed picture. The MACD histogram has slipped below zero to -16.55 as the MACD and signal lines converge, raising the risk of a bearish crossover. However, the Chaikin Money Flow reading remains positive at 0.13, which shows that capital has not left the market at the same pace as the price decline.
According to trader Daan Crypto Trades, Bitcoin is still attempting to close above its weekly 200-period moving average, but a stronger advance is needed to challenge the weekly 200-period exponential moving average.
“Until then, we’re just caught in this $60K choppy price range.”
Spot Bitcoin ETFs have provided limited relief after more than eight weeks of heavy withdrawals, SoSoValue data shows. US-listed funds posted a second consecutive week of net inflows, while BlackRock’s IBIT helped drive a $132 million inflow on Friday despite a $4.2 million withdrawal from Fidelity’s fund. The improvement remains too small to establish aggressive institutional accumulation.
The three-day liquidation heatmap places the largest overhead liquidity concentration around $65,200 to $65,500. A move into that band could force leveraged short positions to close and help BTC challenge the daily resistance near $65,047.
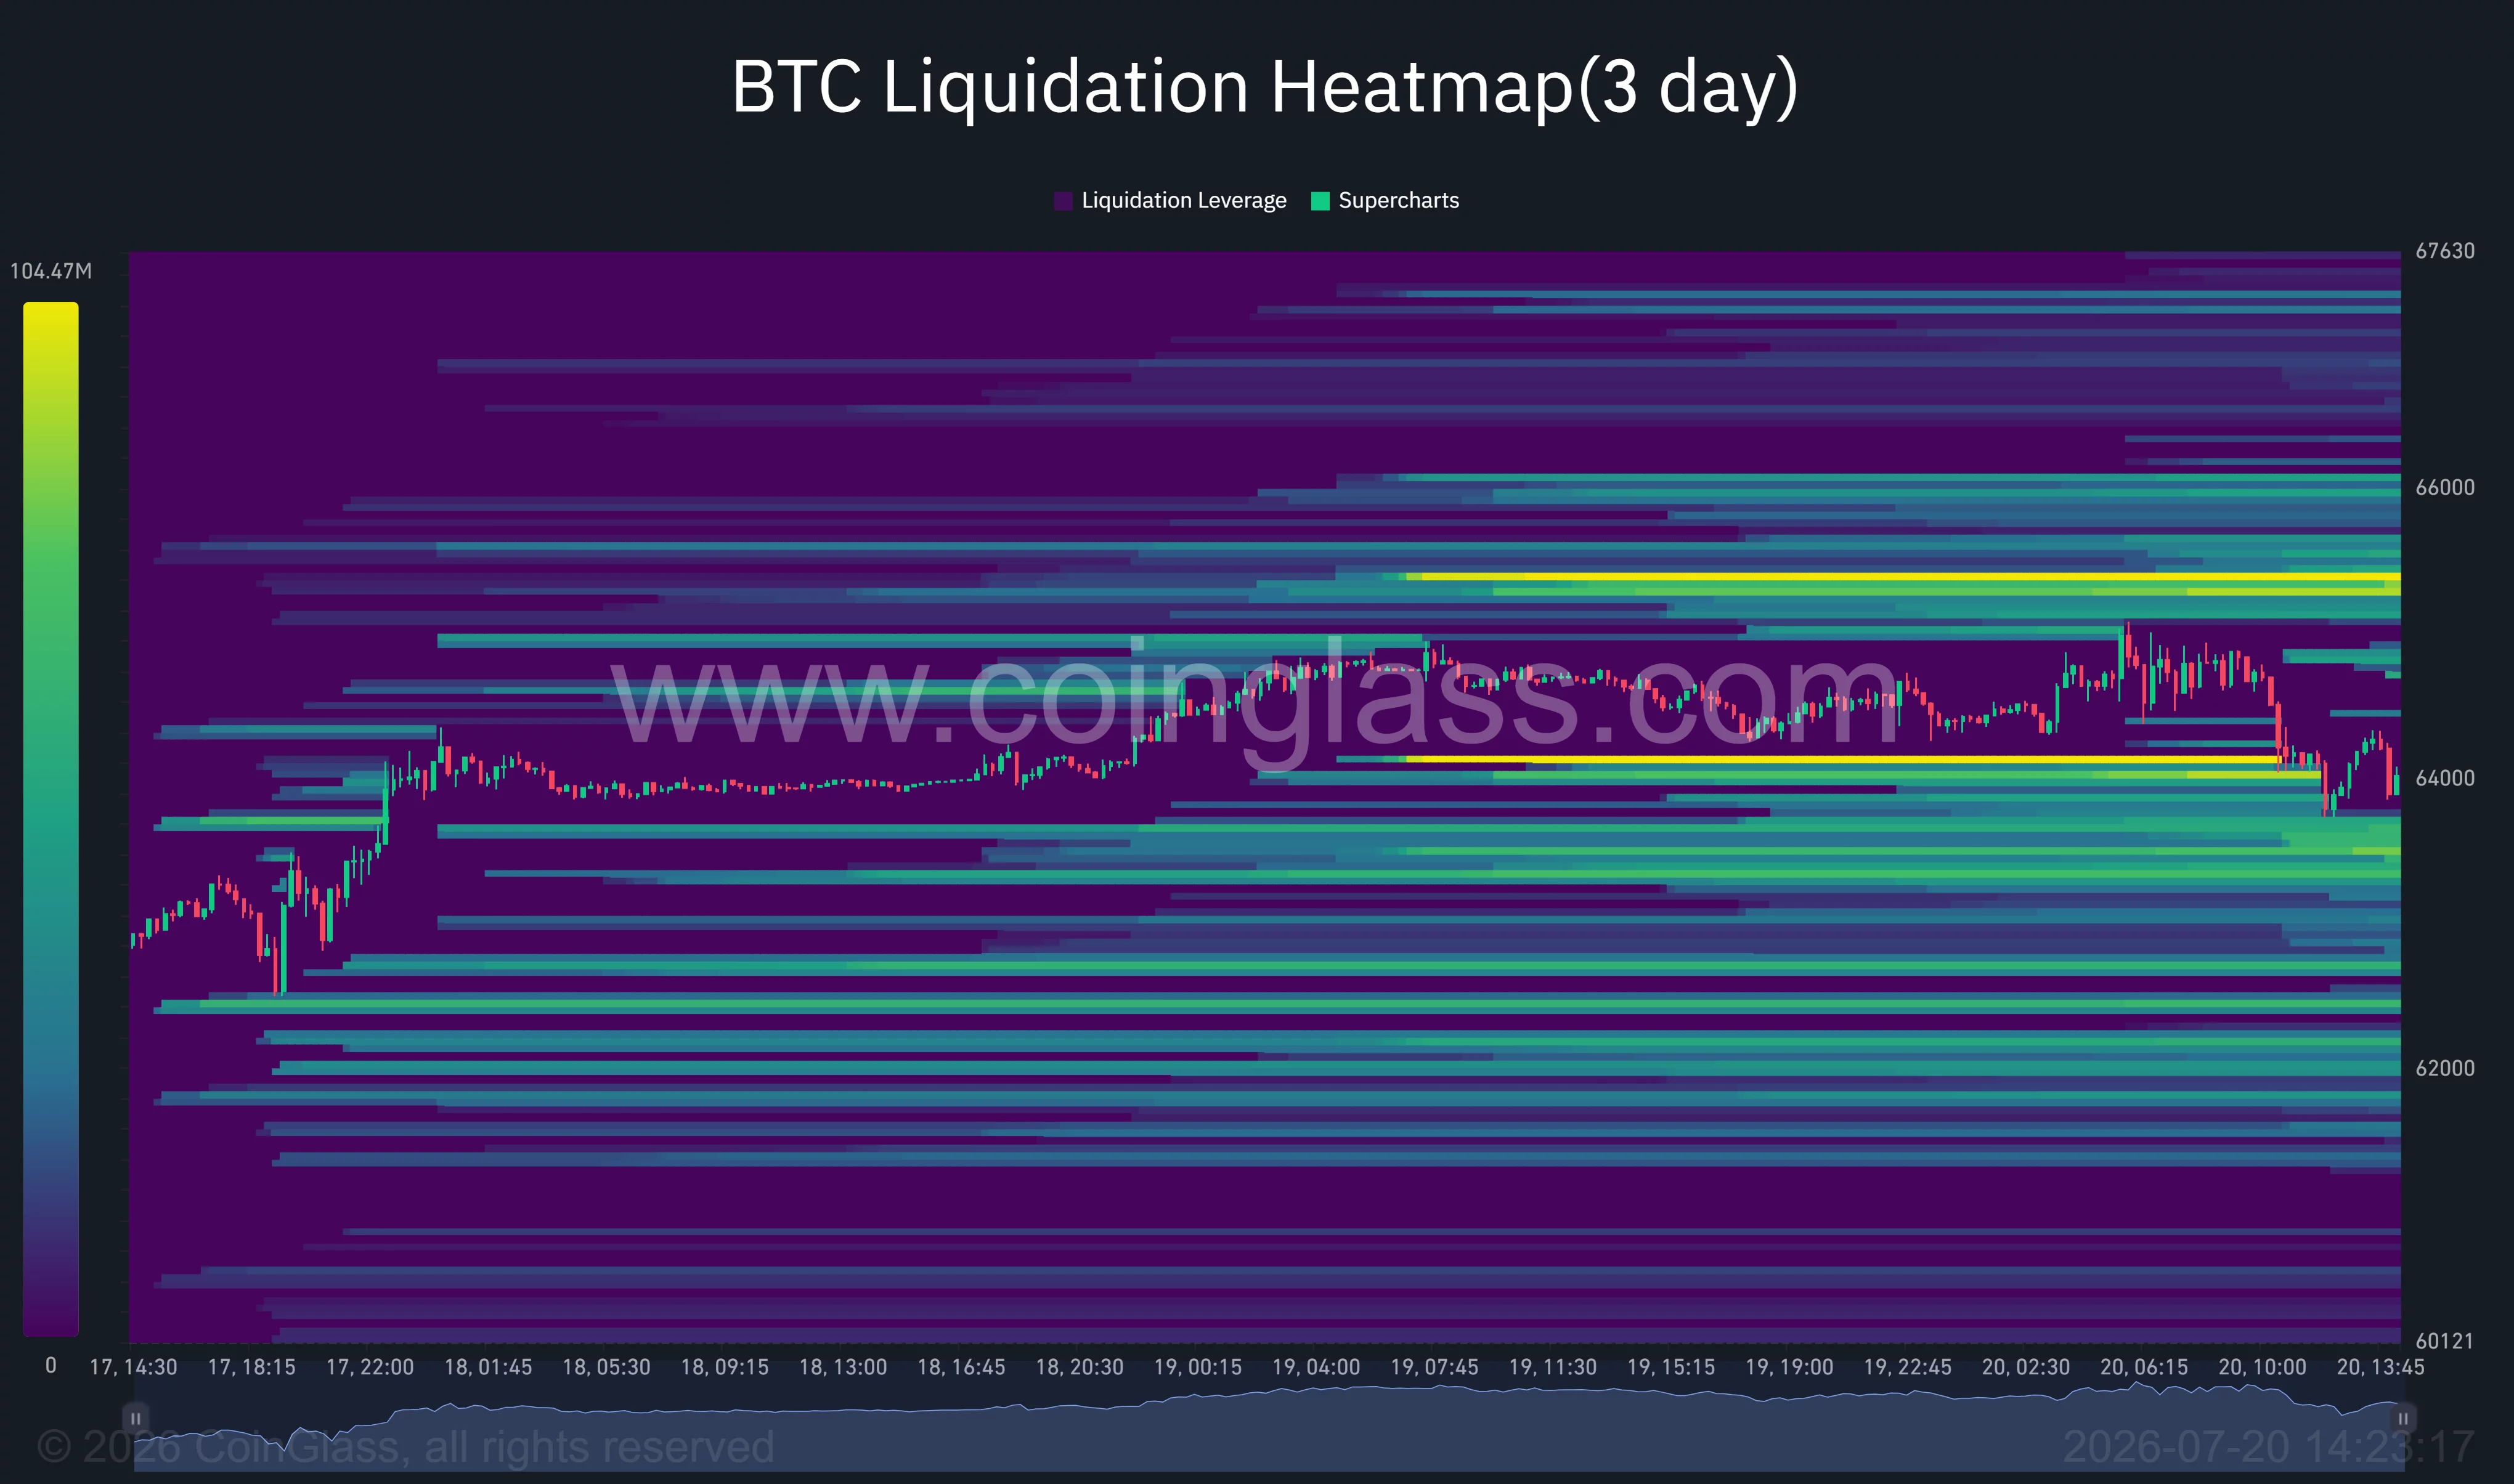
Bitcoin liquidation heatmap | Source:
CoinGlassBelow the market, liquidation pools sit between $63,300 and $63,600, with another concentration around $62,500 to $62,800. Price frequently moves toward dense leverage zones, making either cluster a potential target if volatility expands.
Loss of $62,700 would expose Bitcoin to another capitulation leg
Bitcoin’s recovery thesis would weaken if sellers force a 4-hour close below the 100-period SMA at $63,642. A subsequent break under the 200-period SMA at $62,708 would expose $60,000, followed by the late-June low near $58,000.
Analyst Ardi warned that the current bear-market decline has not produced the severe capitulation seen before previous cycle bottoms. In his view, either months of range-bound trading must exhaust sellers or a deeper liquidation event must clear the remaining leverage.
Oil remains the main external risk. Failed US-Iran negotiations or renewed threats to regional energy routes could send crude higher again, revive inflation fears, and reinforce the Federal Reserve’s higher-for-longer policy stance.
For bulls, a daily close above $65,047 would invalidate the immediate bearish setup and open the path toward $67,000. Without that breakout, Bitcoin remains vulnerable to another sweep of leveraged positions below $63,600.
Disclosure: This article does not represent investment advice. The content and materials featured on this page are for educational purposes only.
Read more: South Korea weighs new legal framework for seizing self custodied crypto