Bitcoin fell about 3% on Thursday, October 15, after hotter U.S. inflation data. BTC dipped close to $80,000 in early Asian trade. It bounced to $81,272, then stalled near $81,000. Traders no
Bitcoin fell about 3% on Thursday, October 15, after hotter U.S. inflation data. BTC dipped close to $80,000 in early Asian trade. It bounced to $81,272, then stalled near $81,000.
Traders now worry the Federal Reserve could raise rates this month. Here is what hit the market, what the charts show, and which levels matter next.
Why Is Bitcoin Down Today After the CPI Report?
The trigger was the Consumer Price Index (CPI). September inflation rose to 3.7% year over year from 3.4%. Economists expected 3.6%.
Core CPI came in at 2.6%, which also beat forecasts.
Metric
Latest Reading
Comparison
Headline CPI (YoY, September)
3.7%
3.4% before, 3.6% expected
Core CPI
2.6%
Above forecasts
One popular crypto post also pointed to a weak U.S. job market. Rising prices and soft hiring leave the Fed in a tough spot.
Higher inflation makes rate cuts harder. So traders sell risky assets, and crypto is often one of them.
The global crypto market cap fell 3.38% in 24 hours to $2.71 trillion. Ether trades near $2,375. XRP and Solana are down 3% to 5%.
Will the Fed Raise Interest Rates in October 2026?
The Fed's current target range is 3.75% to 4.00%. CME FedWatch shows a 70.7% chance of no change at the October 28 meeting.
The chance of a hike is 29.3%.
Oct 28 Fed Outcome
Now
1 Day Ago
1 Week Ago
1 Month Ago
No change (3.75%-4.00%)
70.7%
77.9%
82.3%
53.0%
Hike (4.00%-4.25%)
29.3%
22.1%
17.7%
43.5%
Cut (3.50%-3.75%)
0.0%
0.0%
0.0%
3.5%
Hike bets grew after the CPI print. A month ago they were higher at 43.5%, so the mood has swung both ways.
Another report put a December quarter-point cut at 62.2%. These odds can shift with every new data release.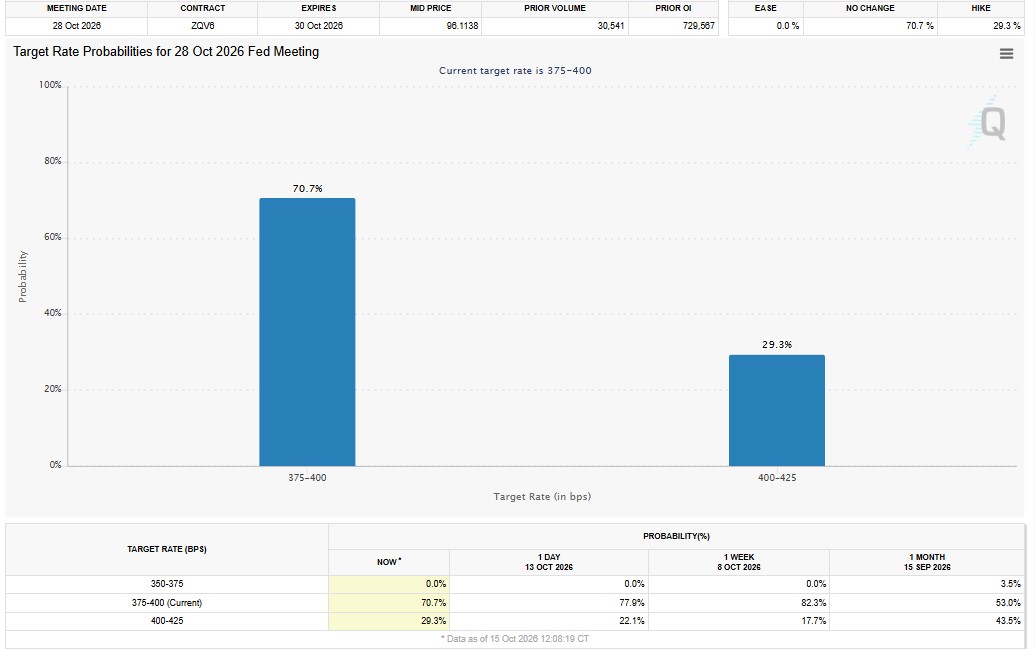
Bitcoin News Today: What Do ETF Flows, Futures and Options Show?
According to SoSoValue, U.S. spot BTC ETFs recorded $261 million in net outflows on October 14. Bitwise's BITB posted the largest inflow, at just $2.22 million.
BTC Derivatives Metric
Reading
BTC price
$81,272.60 (down $2,513.59)
Market cap
$1.63 trillion
Futures volume (24h)
$80.94 billion (up 71.81%)
Open interest
$52.42 billion (up 0.57%)
Options volume
$4.38 billion (up 87.08%)
Long/short ratio (24h)
0.9335
24h liquidations
$201.46 million
Long liquidations
$183.47 million
Short liquidations
$18 million
The 0.9335 ratio points to more shorts across the broader market. Still, Binance and OKX account ratios stay above 1, near 1.77.
The liquidation gap is large. Long traders took most of the pain as price fell.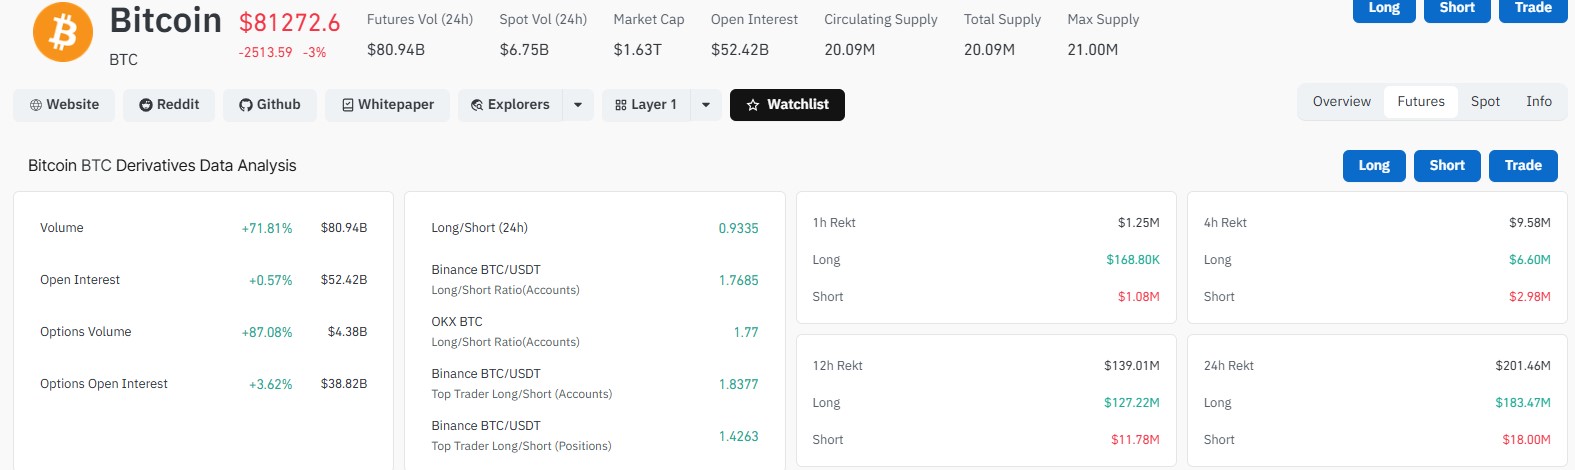
BTC Price Analysis: What Does the 4-Hour Chart Say?
Bitcoin trades near $81,130 inside a descending channel on the 4-hour chart. Price sits below all four key moving averages.
EMA (4-hour)
Level
20
$82,381
50
$82,960
100
$83,145
200
$81,998
RSI is near 38. That suggests weak momentum and keeps the short-term bias bearish for now.
Analyst Michaël van de Poppe is not a fan of the chart. He says BTC could not break $84,000 and shows weakness.
If $82,000 also acts as resistance, he sees the most obvious long spot below $80,000. That is where liquidity is likely to be taken.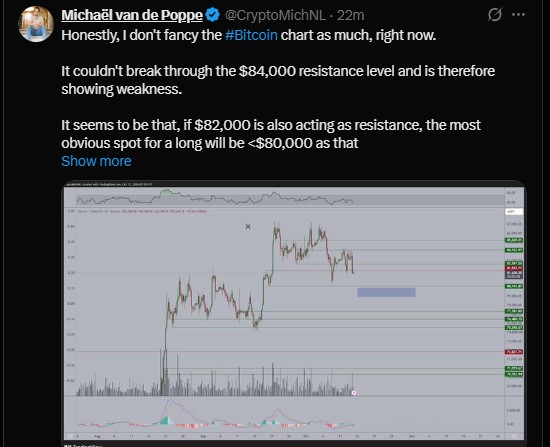
Bitcoin Price Forecast: Will BTC Go Up or Down Next?
Views are split, and that is normal after a sharp CPI move.
Bear case. If BTC loses the $80,000 to $80,500 support zone, $79,000 and $78,000 come into play. One analysis marks $77,000 as key support, with $69,000 below it.
Bull case. Ali Charts compared 2026 with 2023. In 2023, BTC broke out of a range and rose from about $24,000 to above $30,000.
The same view sees a similar breakout from the $82,000 to $87,000 zone this year. Ali marked BTC at $83,836, tracking the 50-day and 200-day averages. Price now sits just under that.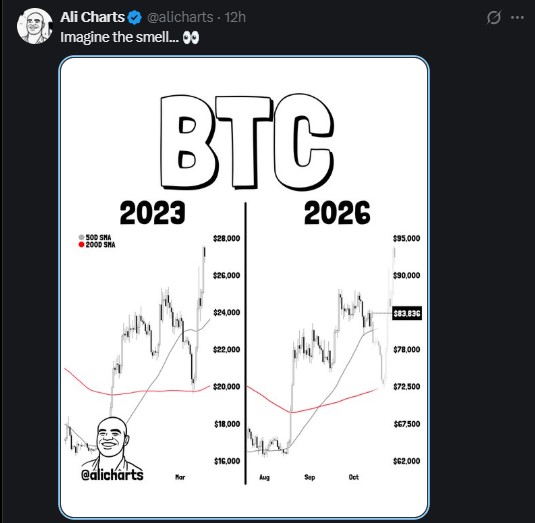
Another analyst, Cup, points to two earlier breakouts of 26.76% and 16.49%. The MACD has reset, he says, and another 15.40% move could target $92,000.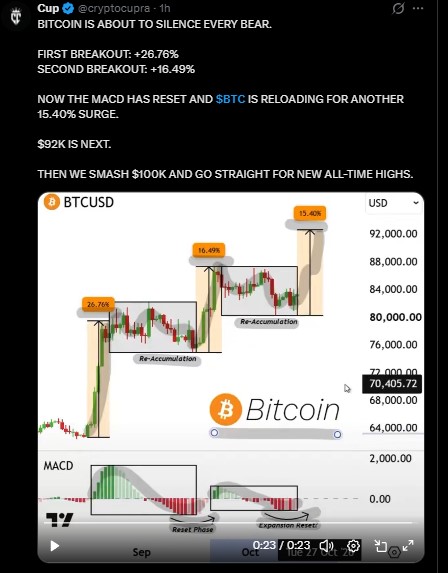
A third chart shows an ascending channel. It eyes a rally to $88,000, then $93,000 at the top of the channel.
Notice the clash. The 4-hour chart shows a falling channel, while others see a rising one. Neither is a promise.
Level
Price
Resistance
$82,000 to $83,150, then $83,500 to $84,000
First support
$80,000 to $80,500
Lower support
$79,000, $78,000, $77,000
Deeper support
$69,000
Upside targets
$88,000, $92,000 to $93,000, then $100,000 to $105,000
What Could Move the BTC Price Next?
U.S. PPI inflation data lands today at 8:30 AM ET. The previous reading was 5.4%, and the forecast is 5.3%.
A Crypto Rover post says a reading above 5.3% could hit markets hard. Below it could spark a rally, and an exact match may bring a mixed reaction.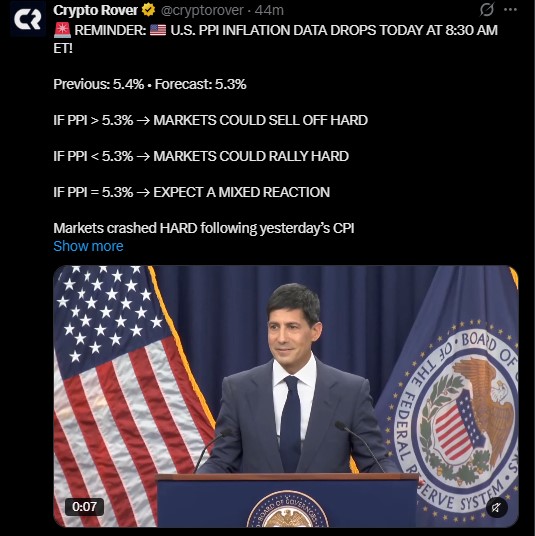
After that, the October 28 Fed meeting is the next big date. ETF flows and liquidation data are worth watching too.
Disclaimer
This article is for information only and is not financial advice. Crypto prices are very volatile, and you can lose some or all of your money. Price targets are analyst views, not guarantees. Do your own research and speak with a licensed financial advisor before you invest.