Bitcoin is back under pressure after climbing toward $88,000 last week. The BTC price is trading around $82,956 now, up just 0.05% on the latest 4-hour candle. But the bigger picture is weake
Bitcoin is back under pressure after climbing toward $88,000 last week. The BTC price is trading around $82,956 now, up just 0.05% on the latest 4-hour candle. But the bigger picture is weaker after the recent drop.
Bitcoin is down 2.33% over 24 hours, underperforming a broadly flat crypto market. The main trigger? Renewed geopolitical tension after the U.S. rejected Iran’s ceasefire proposal. That pushed oil prices and Treasury yields higher, which weighed on risk assets like crypto.
Bitcoin has also been moving closely with gold, with the two assets showing a 95% correlation in the supplied data. That points to both markets responding to the same rates and dollar-related pressures.
Bitcoin Longs Are Starting to Get Flushed
The decline has also forced leveraged traders out of their positions. Bitcoin long liquidations reached $89.39 million over 24 hours, an increase of 520%. That liquidation wave added more selling pressure as leveraged positions were closed.
The initial decline also broke Bitcoin below the 38.2% Fibonacci retracement near $82,620, with trading volume increasing by 84%. This matters because the Bitcoin price is no longer dealing with technical selling alone.
Leverage has become part of the move, and the next few sessions could show whether traders continue reducing exposure or start rebuilding positions. For now, the market remains caught between buyers trying to defend support and sellers looking for another move lower.
Read Also: Crypto Price Predictions for Today, September 28: Bitcoin (BTC), XRP and Ethereum (ETH)
The Bitcoin Price Level Bulls Need to Defend
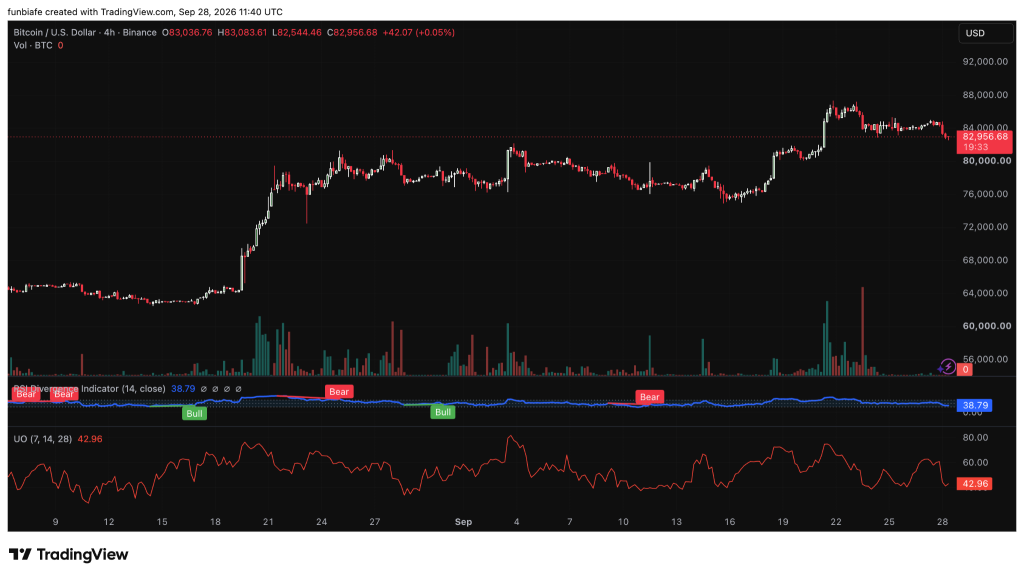
We had a look at the Bitcoin chart, and the $82,000-$82,500 zone stands out as the first area bulls need to protect. The Bitcoin price is around $82,956, keeping it just above that support region.
 Source: TradingView
If buyers defend this area, BTC could head back toward $84,000. A break above that would bring $88,000 into view, followed by $92,000. The downside gets more concerning below $80,000. The chart puts the next supports at $76,000, $72,000, $68,000, $64,000, and $60,000.
Momentum readings are mixed. The 4-hour RSI is at 38.79, weak, but it shows both bullish and bearish divergences. The Ultimate Oscillator is at 42.96, below 50, pointing to neutral-to-bearish momentum. So Bitcoin doesn’t have a clear directional signal yet.
Bitcoin Price Outlook for the Next Few Days
The next move likely comes down to two boundaries: $84,000 and $80,000. If Bitcoin reclaims $84,000, the next levels on the chart are $88,000 and $92,000. If it drops below $80,000, the market could head toward $76,000 and $72,000, with $68,000, $64,000, and $60,000 further down.
There’s also a macro catalyst coming. U.S. PCE inflation data drops on September 30, and the result could shape expectations around Fed policy. At the same time, traders are watching the Strait of Hormuz, oil prices, and Treasury yields.
For now, Bitcoin is still inside the $80,000–$88,000 range. The $82,000–$82,500 zone is the immediate area to watch, but a break below $80,000 would open the door to a much deeper test of support.
FAQs
How could the U.S. PCE inflation report affect Bitcoin
The PCE inflation report is closely watched because it can influence Federal Reserve policy expectations. Higher-than-expected inflation could pressure risk assets, including Bitcoin.
Is Bitcoin still in a long-term uptrend
Many traders still view the current decline as a correction within a broader uptrend. However, maintaining support above key levels such as $80,000 remains important for that outlook.
Subscribe to our YouTube channel for daily crypto updates, market insights, and expert analysis.
The post Bitcoin Price Warning: One More Drop Could Change the Entire Setup appeared first on CaptainAltcoin.