Bitcoin price is trading near $70,000 after one of the best days for crypto in 2026. Ethereum has pumped above $2,200 , and altcoins are rallying as well. The rally was driven by several cata
Bitcoin price is trading near $70,000 after one of the best days for crypto in 2026. Ethereum has pumped above $2,200 , and altcoins are rallying as well.
The rally was driven by several catalysts:
- The US Treasury announced it would double its bond buyback operations from $2 billion to $4 billion per operation starting in September, injecting additional liquidity into financial markets.
- President Donald Trump hosted a White House gathering with cryptocurrency leaders and key federal regulators, signaling a potential shift toward more defined and favorable regulatory frameworks.
- The SEC proposed regulations that provide a clearer path for crypto companies to raise capital and could allow mature networks like Bitcoin and Ethereum to exit securities classification.
The combination of macro liquidity, political support, and regulatory clarity has boosted institutional confidence. But Glassnode is urging caution.
What Glassnode’s Data Shows
The on-chain analytics firm has issued a warning: this rally may not be what it seems. While the Bitcoin price action is bullish, the underlying metrics have not yet confirmed a full trend reversal.
Relative Unrealized Loss: A Key Metric
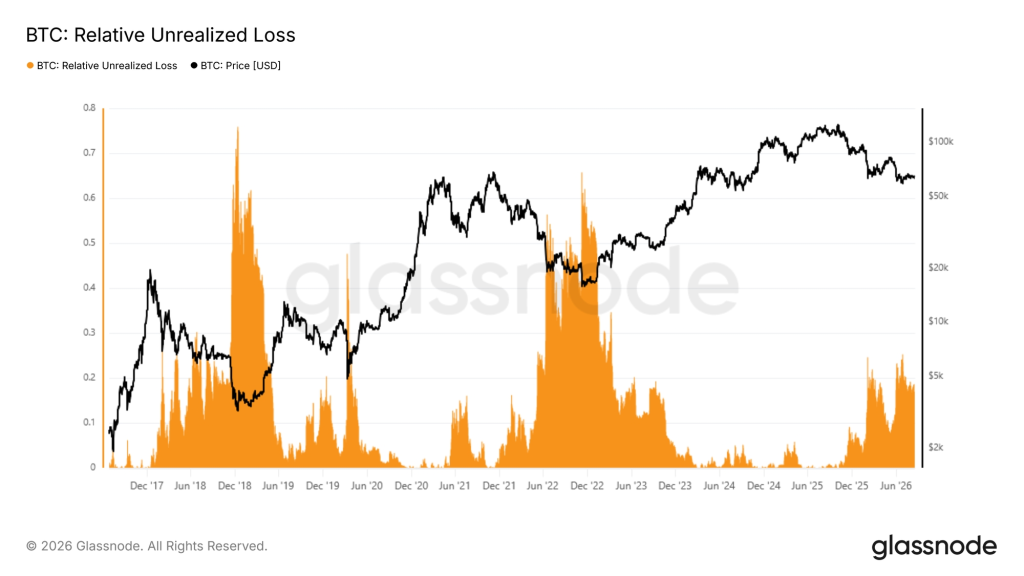
The chart Glassnode shared shows Bitcoin’s Relative Unrealized Loss, which measures how much aggregate unrealized loss Bitcoin holders are carrying relative to market value. When the orange area spikes, a larger portion of the market is sitting on substantial paper losses. Historically, the biggest spikes have coincided with severe bear-market stress.
In the 2018 bear market, Relative Unrealized Loss reached roughly 0.60+ . In 2022, it climbed above roughly 0.60 around the deepest period of market stress.
The current cycle looks very different. During the recent Bitcoin decline, Relative Unrealized Loss peaked at only around 25% . That is meaningful stress, but nowhere close to the 60%+ readings associated with previous major capitulation events.
 Source: glassnode
2018: extreme holder pain → major capitulation2022: extreme holder pain → major capitulation2026: noticeable holder pain → but not historically extreme
Glassnode is not saying Bitcoin must crash further. Market structures change. Institutional participation, ETFs, and Bitcoin’s maturation can all mean future cycles don’t perfectly reproduce 2018 or 2022. But the point is that one historically useful marker of deep capitulation has not reached the extremes associated with previous major bottoms.
Bitcoin Remains Below Key On-Chain Levels
Bitcoin remains below two important on-chain levels:
LevelSignificance
$68,500Short-Term Holder Cost Basis
$75,800True Market Mean
If Bitcoin is below both, Glassnode’s models do not yet see the market as having convincingly escaped its stressed regime.
The hierarchy:
- BTC below ~$68.5K: market remains weak
- Reclaim ~$68.5K: first meaningful improvement
- Reclaim ~$75.8K: substantially stronger evidence
- Hold above these levels: trend-reversal argument becomes more credible
A Bitcoin pump by itself is not enough. Glassnode wants to see structural recovery, not simply several strong green candles.
The Realized Profit/Loss Ratio Is Another Warning
The 90-day Realized Profit/Loss Ratio is around 0.75. Glassnode says historical seller exhaustion has generally occurred when this falls below approximately 0.5. During genuine capitulation, losing investors eventually dump coins aggressively. Loss realization becomes extreme. Eventually, the pool of investors willing or forced to sell becomes exhausted. That is often when durable bottoms become possible.
But the current reading of 0.75 indicates the process has not reached the same degree of exhaustion. Again, it does not prove another crash is coming. It means Glassnode does not yet have the seller-exhaustion confirmation it wants.
Despite derivatives improving and ETF flows stabilizing, the Coinbase Premium remains negative. That is huge because Coinbase is commonly used as a proxy for U.S. institutional and spot-market demand. A negative premium indicates that Bitcoin is trading less strongly on Coinbase relative to offshore venues.
Glassnode is not seeing convincing evidence that U.S. spot buyers have aggressively returned. That is an important distinction. You could have futures traders becoming bullish, shorts covering, and the broader crypto market pumping – without having strong underlying spot accumulation. The latter would make the rally much more convincing.
There Are Some Bullish Signs
Glassnode is not presenting an entirely bearish picture. Two things have improved:
- Perpetual futures demand has turned positive – traders are becoming more willing to take leveraged bullish exposure.
- ETF flows are stabilizing – persistent outflows can place significant pressure on the market. Stabilization removes at least some of that headwind.
The rebound is not happening with zero supporting evidence. The problem is where that demand is coming from and whether it is strong enough to change the broader trend.
Read also: We Asked 3 AI Models What $5,000 in Bitcoin Could Be Worth by 2030
What Would Make Glassnode’s View More Bullish?
Glassnode would become more confident in a sustained recovery if:
- Bitcoin reclaims the ~$68,500 Short-Term Holder Cost Basis
- BTC subsequently recovers the ~$75,800 True Market Mean
- The Coinbase Premium turns positive, which means stronger U.S. spot demand
- The Realized Profit/Loss Ratio strengthens toward ~2
- Financial conditions improve, particularly through lower yields
If several of those happen simultaneously, today’s “local rally” could start looking much more like an actual trend reversal.
The Main Takeaway
Bitcoin may be pumping, but the on-chain evidence has not yet confirmed that the broader downturn is finished. The current rally has some legitimate support – derivatives demand is improving and ETF flows are stabilizing – but several important signals remain missing. Bitcoin is still below approximately $68.5K and $75.8K, U.S. spot demand remains weak according to the negative Coinbase Premium, and seller exhaustion has not reached historical extremes.
Glassnode is not necessarily predicting that Bitcoin must crash again. The firm is saying something more nuanced: until Bitcoin proves otherwise through on-chain profitability, spot demand, and key price-level recoveries, strong pumps should be treated as rallies occurring within the existing stressed regime – not automatically as the beginning of a new bull trend.
Subscribe to our YouTube channel for daily crypto updates, market insights, and expert analysis.
The post Bitcoin Price Warning: This BTC Rally May Not Be What It Seems appeared first on CaptainAltcoin.