Key Takeaways BTC trades near $63,300, up 4.58% over seven days. Q1 fell 22%, Q2 lost 14%, Q3 already up 7.3%. ETH gained 13% weekly, back above $1,800. A close above $64,000 could break the
Key Takeaways
- BTC trades near $63,300, up 4.58% over seven days.
- Q1 fell 22%, Q2 lost 14%, Q3 already up 7.3%.
- ETH gained 13% weekly, back above $1,800.
- A close above $64,000 could break the downtrend structure.
Bitcoin is trading around $63,300 on 4th of July, up 1.22% on the day after printing high of $63,455. The move extends a recovery leg that began at the $58,000 area on July 1, a level that was tested three times in late June and held each time, forming the short-term base the current bounce is built on.
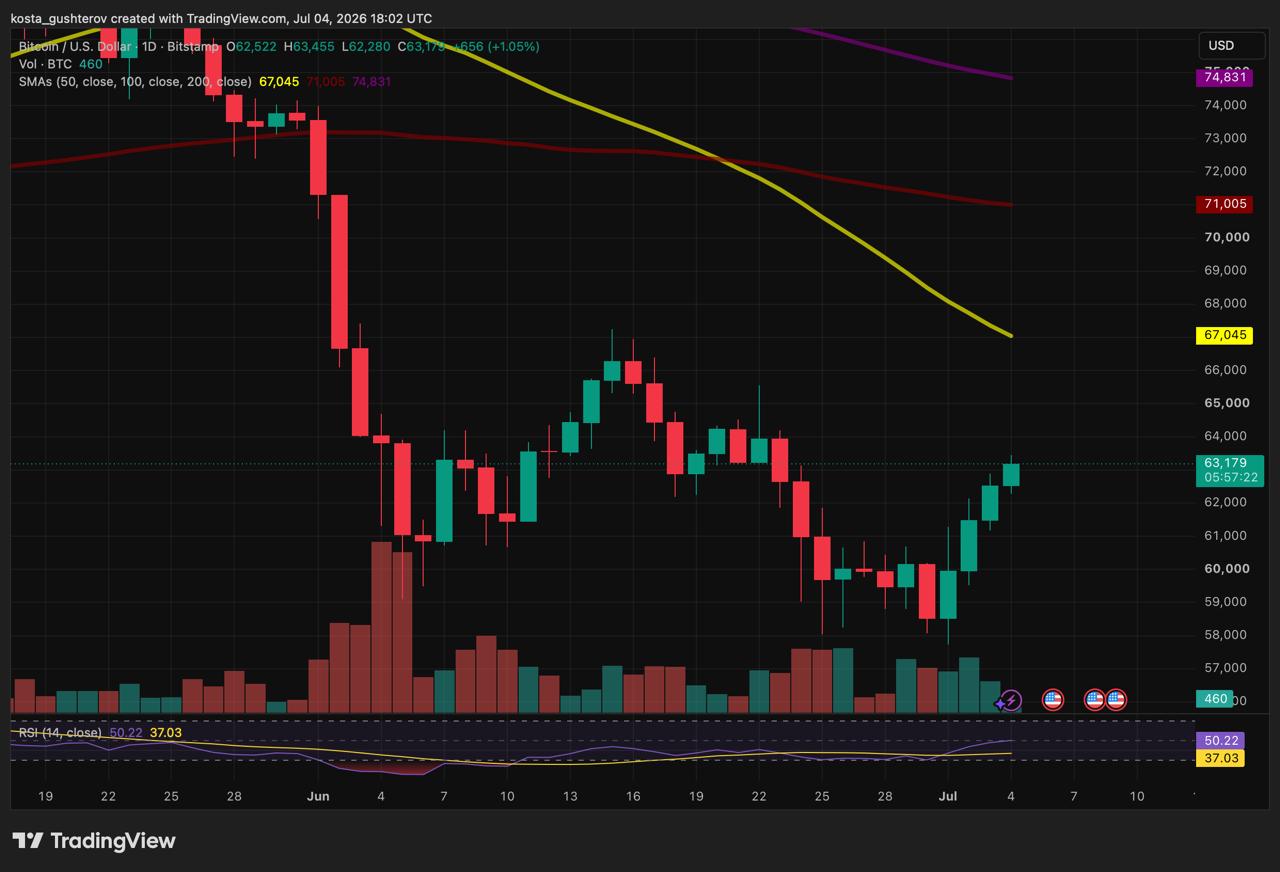
BTC/USD daily technical chart on Bitstamp / Source: TradingView
The trend context remains bearish. Price sits below all three major daily moving averages, the 50-day at $67,047, the 100-day at $71,006, and the 200-day at $74,831, and all three continue to slope downward. The daily RSI at 50.60 has crossed into neutral territory from oversold conditions, momentum improving without yet confirming a reversal.
The level traders are watching is directly overhead. The $64,000 area is the next close resistance: it capped the late-June rebound attempt and marks the neckline of the recovery structure. Beyond it, the heavier supply zone runs from $66,000, the mid-June swing high, to the falling 50-day average at $67,047. On the downside, $60,000 is the first support, followed by the $58,000 base that was defended on three separate tests in late June and early July.
From Two Red Quarters to a Green Start
The quarterly picture explains why the current bounce carries more narrative weight than its size suggests. According to Coinglass data, Bitcoin lost 22.2% in the first quarter of 2026 and another 14.09% in the second, the asset’s worst first half since 2022, taking price from above $93,000 at the start of the year to roughly $60,000 by the end of June.
Three sessions into the third quarter, Bitcoin is up 7.3% according to data from Coinglass. A single week does not repair a downtrend, but the timing matters: the gains arrived alongside the first Bitcoin ETF inflows in two weeks and a weak June jobs report that sharply reduced the market-implied odds of a Federal Reserve rate hike this month. The macro calendar now points to July 28–29, when Kevin Warsh’s Fed meets, an event most analysts treat as the month’s decisive catalyst for risk assets.
- Seasonality leans the same direction: July has historically closed green in years when June closed red, with only three exceptions since 2013.
YearQ2 (Red)Q3 (Green)2026-14.09%+7.34%2024-11.92%+0.96%2018-7.71%+3.61%2013-3.97%+40.6%
The bounce is broader than Bitcoin. Ethereum gained 13.13% over the past week to trade above $1,800, nearly tripling Bitcoin’s 4.58% weekly advance, while the CMC20 index of the largest assets rose 5.47%. Altcoins outperforming Bitcoin during a recovery leg typically signals improving risk appetite rather than defensive positioning, the same pattern visible in this week’s meme coin and Solana strength.
What Analysts Expect Next
The forecast landscape splits sharply. On the cautious side, 10x Research head Markus Thielen argued this week that the market still lacks a marginal buyer, noting Strategy’s acquisitions have slowed and spot ETFs shed roughly $7 billion since mid-May. “There’s no real buyer in the market right now,” Thielen said, mapping a potential decline toward $46,000–$47,000 before a recovery rally toward $60,000–$65,000 by year-end, with a cycle bottom forming as late as the fourth quarter. Citigroup’s bearish scenario sits at $53,000.
FxPro chief market analyst Alex Kuptsikevich called last week’s price action “a rather dangerous consolidation for the bulls” while Bitcoin was pinned below $60,000, flagging $40,000 as the next meaningful support if the floor gave way. The recovery above $63,000 buys distance from that edge without invalidating the warning. Popular analyst Rekt Capital estimated in analysis, shared by TradingView that the bear trend was roughly 71% complete as of late June, with new lows still possible before a long-term floor forms, while onchain platform CryptoQuant flaggs what it called the first bottoming signal of the cycle in the same report.
READ MORE:
 Crypto Outperforms Gold and S&P 500 Over the Past Week
The constructive case rests on the levels currently in play: a defended $58,000 floor, returning ETF inflows, a Fed repricing in Bitcoin’s favor, and a market trading roughly 50% below its October 2025 peak of $126,000, historically the drawdown depth where prior cycles began building durable bottoms. If price closes above $64,000 with continued fund inflows, the downtrend-break scenario gains evidence; if the Fed meeting delivers a hawkish surprise, the Thielen path back below $58,000 reopens.
Bitcoin Every Fourth of July
Independence Day has become an informal annual checkpoint for the asset. The July 4 price through the years according to TradingView data:
2010: approximately $0.01
2011:$14
2012:$6.58
2013:$80
2014:$630
2015:$260
2016:$683
2017:$2,600
2018:$6,600
2019:$11,215
2020:$9,130
2021:$35,290
2022:$20,250
2023:$30,800
2024:$57,090
2025:$108,156
2026:~$63,300 at the time of writing
The list captures both truths about the asset at once. Bitcoin trades 41% below where it stood one year ago, the third July-to-July decline in its history after 2015 and 2022. Both prior instances occurred in the year following a cycle peak, and both preceded recoveries to new highs within two years, a precedent, not a promise.
The week changed the tone but not yet the trend. Bitcoin above $63,000 with a green quarter-to-date is meaningfully different from Bitcoin at $58,000 with accelerating ETF outflows, and the two-week window into the Fed meeting will determine which of those states was the anomaly. The summary for the moment: the burden of proof still sits with the bulls below $64,000, but for the first time since May, they are close enough to the level to test it.
This article is for informational purposes only and does not constitute financial or investment advice. Cryptocurrency markets are highly volatile. Always conduct your own research before making investment decisions.
The post Bitcoin Reclaims $63,000 on 4th of July After Three Green Days appeared first on Coindoo.