ey Highlights Bitcoin is at $75,522 — down 6.28% in 24 hours — after a failed recovery above $80,000 CryptoQuant analyst @xwinfinance: "spot buying has not recovered enough to support a susta
ey Highlights
Bitcoin is at $75,522 — down 6.28% in 24 hours — after a failed recovery above $80,000
CryptoQuant analyst @xwinfinance: "spot buying has not recovered enough to support a sustainable uptrend"
11,003 BTC left exchanges on Nov. 5; large-wallet accumulation turned positive — but ETF flows and stablecoin liquidity remain weak
Watch $73,000 — loss of this level removes the final structural case for near-term recovery
Bitcoin is trading at $75,522 — down 6.28% in 24 hours and carrying a market cap of $1.52 trillion — after a recovery above $80,000 collapsed without confirmation from the one metric that actually matters: spot demand. The futures market offered a temporary reprieve. The spot market did not follow. That divergence, according to a CryptoQuant analyst, is precisely why the rebound failed.
An analyst publishing under the handle @xwinfinance on CryptoQuant’s Quicktake platform identified the structural gap that ended the $80K recovery. In their words: “The key issue is still spot demand. Futures positioning improved temporarily, but spot buying has not recovered enough to support a sustainable uptrend.” This is not a technical observation about a single candle — it is a diagnosis of the demand structure underlying the entire recovery attempt.
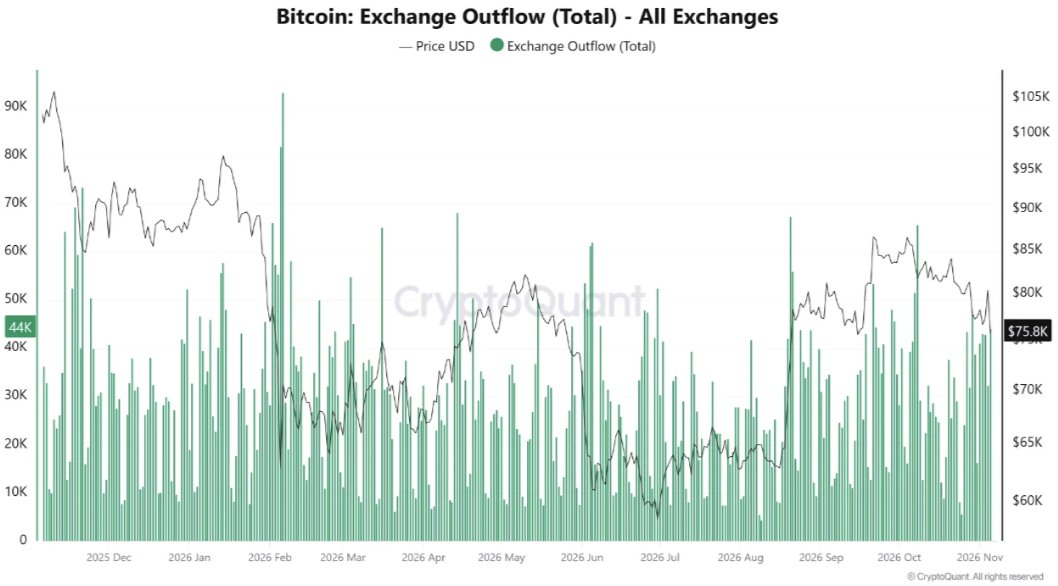
BTC Exchange Outflows | Source: @cryptoquant_com (X)
The distinction between futures-driven and spot-driven price moves matters because they carry fundamentally different durability. Futures positioning can shift in hours — driven by leverage, funding rate arbitrage, or short-covering. Spot demand reflects genuine buyers who are acquiring and removing BTC from circulation. When spot demand is absent, any futures-led rally is structurally unsupported: it can lift price, but it cannot hold it.
This is exactly what the chart data shows. According to the CryptoQuant analysis, exchange outflows registered approximately 11,003 BTC leaving exchanges on November 5 — a constructive signal in isolation. The 60-day accumulation metric for wallets holding more than 10,000 BTC also turned positive over the same period. These are real signals. But they exist alongside a contradicting data point: retail-sized BTC inflows to Binance rose sharply, suggesting that shorter-term holders — the cohort most likely to sell into strength — may still be under distribution pressure.
The analyst’s framework is explicit. For a durable rebound, three conditions must converge simultaneously — not sequentially:
Spot demand must recover from its current suppressed state
ETF flows must reverse from their current weekly weakness
Stablecoin liquidity must rebuild — it has not recovered as of the time of publication
ETF flows are a particularly important variable here. Spot Bitcoin ETF flows represent institutionally-sourced spot demand — the exact category of buying that the market is currently missing. When ETF flows are weak on a weekly basis, as they are now, it compounds the absence of organic spot buying. Stablecoin liquidity acts as dry powder: without sufficient stablecoin supply ready to convert into BTC, the market lacks the fuel for sustained upside even when sentiment improves.
None of these three metrics has shown the simultaneous recovery needed to validate a new leg higher. This, in the analyst’s framing, means the burden of proof remains entirely on the bulls.
With BTC currently at $75,522, the market is sitting inside the support zone the CryptoQuant analyst identifies as the near-term pivot: $73,000–$76,000. This is the range that must hold for any recovery thesis to remain structurally intact. The analyst’s framing is deliberate: “Can BTC hold the $73,000–$76,000 support zone?” — posed as an open question, not a prediction.
The macro context matters here. According to the CryptoQuant report, BTC’s pullback from $80,000 coincided with a sharp sell-off in U.S. tech and AI stocks — a correlation that underscores how intertwined Bitcoin’s near-term moves have become with risk-asset sentiment. When equity markets de-risk, the spot demand that should be the foundation of a crypto rally often retreats in parallel. This dynamic reinforces why spot demand is the analyst’s primary focus rather than derivatives positioning. For more on how Bitcoin’s on-chain structure has evolved through this period, see Bitcoin Bottom Is In — Short-Term Holder Realized Price Confirms Local Floor and Bitcoin Tests Trader Realized Price — The Level That Flips From Support to Resistance.
The 11,003 BTC exchange outflow on November 5 and the positive turn in the large-wallet accumulation metric are constructive data points — but the analyst is careful not to overweight them. Selling pressure may be easing. That is not the same as buying pressure building. A market where sellers step back is different from a market where new buyers step in. The former creates a floor; the latter creates a rally.
Retail inflows to Binance rising sharply is the signal that complicates the outflow narrative. If the wallets receiving BTC from exchanges are retail-sized accounts that entered at higher prices, the exchange outflow metric is not capturing genuine accumulation by conviction holders — it may be capturing distribution to weaker hands. The analyst flags this explicitly as a reason why the near-term demand picture remains mixed. See also: Bitcoin Is Higher 1 Year After Every Midterm — But the Sample Size Is 4 for context on how macro cycles interact with Bitcoin’s demand structure.
The CryptoQuant analysis reaches a clear conclusion without offering a directional price target. Selling pressure is easing — that is acknowledged. But “a durable rebound still needs new buyers.” Those new buyers must arrive through the spot market, through ETF inflows, and supported by recovered stablecoin liquidity. Until all three are present and confirmed together, any price recovery will face the same structural ceiling that ended the $80,000 attempt.
At $75,522, Bitcoin is at the lower end of the support zone the analyst is monitoring. Whether that zone holds — and whether spot demand, ETF flows, and stablecoin liquidity recover in time to defend it — is the only question that matters in the sessions ahead. Watch $73,000 as the level whose loss would remove the final structural argument for a near-term recovery.
Disclaimer: The views and analysis presented in this article are for informational purposes only and reflect the author’s perspective, not financial advice. Technical patterns and indicators discussed are subject to market volatility and may or may not yield the anticipated results. Investors are advised to exercise caution, conduct independent research, and make decisions aligned with their individual risk tolerance.
Also Read: ETH Smart Trader With 100% Win Rate Opens $45.3M Long After Market Drop