Crypto just closed one of the ugliest earnings weeks in its short public-market history. Strategy, the largest corporate holder of Bitcoin on the planet, reported an $8.22 billion net loss fo
Crypto just closed one of the ugliest earnings weeks in its short public-market history. Strategy, the largest corporate holder of Bitcoin on the planet, reported an $8.22 billion net loss for the second quarter. Coinbase followed with a $359 million loss and its third consecutive revenue miss. And Bitcoin, the asset underneath both stories, spent the week sliding under $63,000.
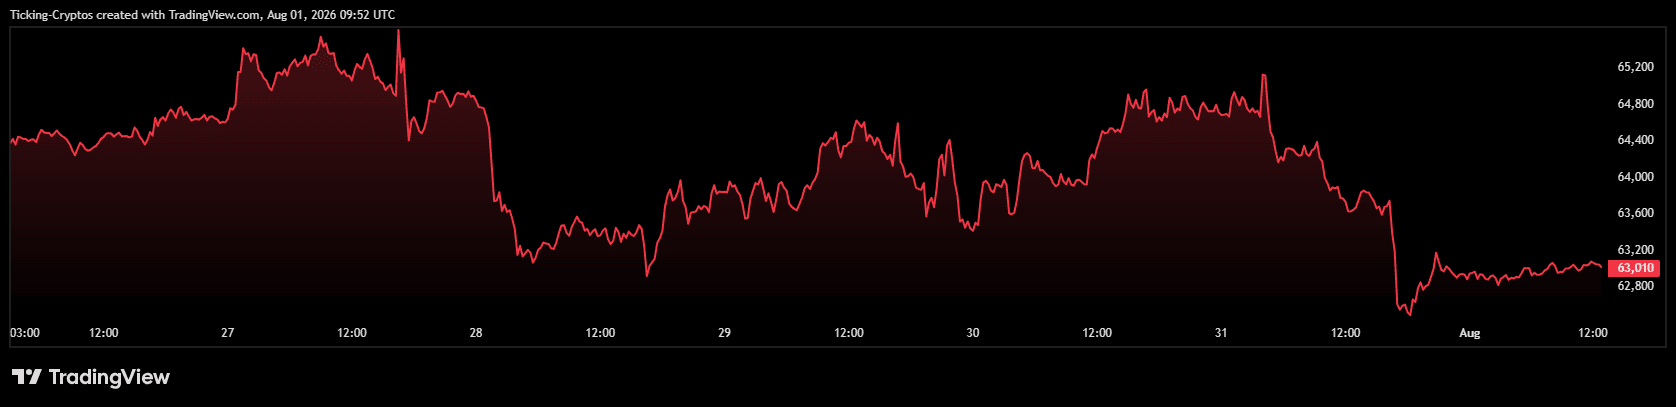 Bitcoin price in the past week
None of this happened in isolation. A hawkish Federal Reserve, a 27% Bitcoin drawdown since January, and a market structure bill stuck in the Senate have combined into the most defensive backdrop crypto has seen since 2022. Here is what actually happened, and what matters from here.
What Exactly Did Strategy Report?
The headline number is enormous, but it needs context. Strategy posted an operating loss of $8.33 billion for Q2 2026, driven almost entirely by an $8.32 billion unrealized markdown on its digital assets under fair-value accounting. Net loss came in at $8.22 billion, or $24.45 per diluted share.
Twelve months earlier, the same accounting treatment produced a $14.05 billion unrealized gain and $10.02 billion in net income. That is roughly an $18 billion swing in reported earnings, with no change to the underlying business model.
The software business, almost forgotten at this point, actually grew. Revenue rose 6.9% year over year to $122.4 million, with gross margin at 66.6%.
Michael Saylor framed the quarter as a phase of muted sentiment rather than a structural problem, and reiterated the company's push to build out what it calls Digital Credit as a new asset class.
Is Strategy's Bitcoin Position Actually in Danger?
This is the question that matters, and the answer is more nuanced than the headline suggests.
Strategy held 843,775 $BTC as of 26 July, up 25% since the start of 2026. Those coins carry an aggregate acquisition cost of roughly $63.69 billion and were worth about $54.77 billion at the time of reporting. Average cost basis sits near $75,476 per coin, which puts the position roughly $10,700 underwater per Bitcoin and around $8.9 billion below cost in total.
Crucially, that loss is unrealized. It reflects mark-to-market movement, not selling. The company did sell approximately $218.4 million of Bitcoin this year, but that was to fund preferred stock dividends rather than a forced unwind.
The balance sheet work is where the real story sits. Strategy raised $17.06 billion through at-the-market share offerings this year, cut convertible notes from $8.21 billion to $6.71 billion via a discounted $1.5 billion repurchase, and built a dollar reserve of $3.75 billion. Management says that reserve covers about 2.1 years of preferred dividends and interest under current policy.
Translation: the company is not in immediate distress. But its capital structure has become complex enough that investors are now scrutinising the dividend machine as closely as the Bitcoin stack.
Why Did Coinbase Disappoint Again?
Coinbase reported revenue of $1.22 billion, down 18.5% year over year, against roughly $1.30 billion expected. GAAP loss came in at $1.36 per share versus consensus near breakeven. Shares fell around 6% after hours to about $153.
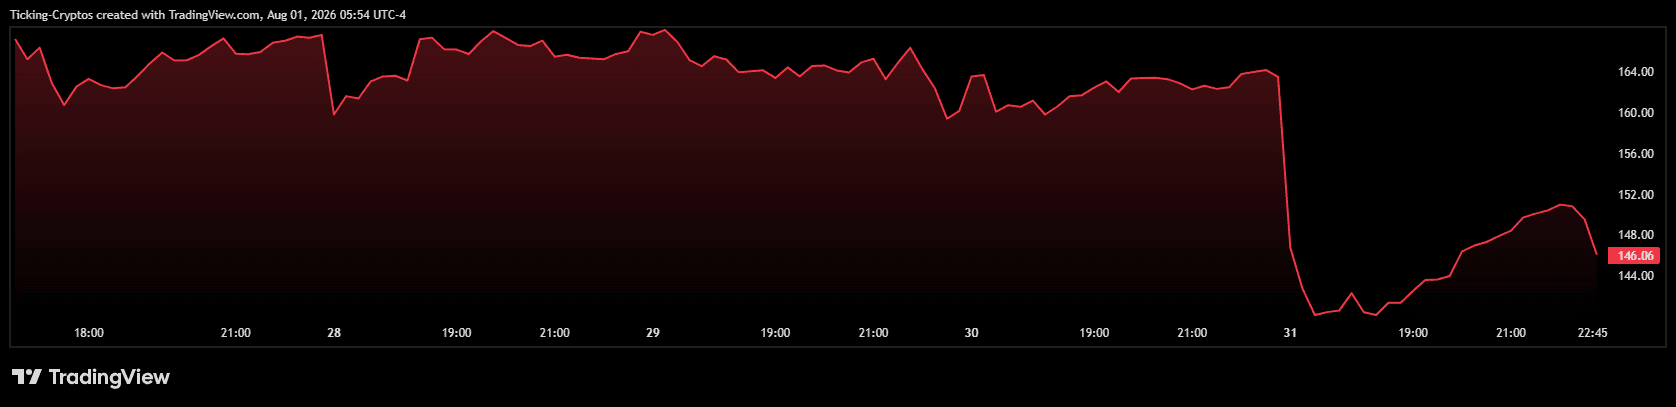 Coinbase price in USD
The problem is straightforward: total crypto market capitalisation fell 11% quarter over quarter and spot trading volumes dropped 25%. Transaction revenue landed at $599 million, subscription and services at $555 million, and stablecoin revenue slipped to $292 million. Monthly transacting users fell to 7.6 million from 8.7 million a year earlier, while assets on platform dropped to $245.9 billion from $425 billion.
The bright spots were real, though. Coinbase took a record 10.3% share of global crypto trading volume, its third straight quarterly high. Prediction markets revenue more than doubled quarter over quarter and crossed $100 million annualised. Adjusted EBITDA stayed positive at $207.8 million, the fourteenth consecutive positive quarter. Bitcoin-linked transactions now account for just 12% of revenue, down from more than half historically.
Brian Armstrong summarised the pitch bluntly, saying the company is no longer just a bet on the Bitcoin price. The market, for now, is not paying for that story.
What Is the Fed Doing to Crypto Right Now?
Macro is the pressure that turned a soft quarter into a bad one.
The FOMC held rates at 3.50% to 3.75% at its 29 July meeting, but the tone was the hawkish part. Three regional Fed presidents dissented in favour of an immediate hike, and Chair Kevin Warsh made clear that inflation above 2% is not acceptable. With inflation running near 4.1%, a cut is off the table and a September hike is now a live debate.
For crypto, tighter liquidity is a direct tax on leverage. Holding leveraged positions gets more expensive, risk appetite compresses, and capital rotates toward cash and short-duration paper. DWF Labs managing partner Andrei Grachev called the hawkish hold the least favourable outcome available and argued institutional positioning should turn defensive.
Regulation has not helped either. Odds on the CLARITY Act passing collapsed toward the high 20s on prediction markets after the Senate missed its August deadline, even as a 616-page merged committee draft circulated.
Where Does Bitcoin Go From Here?
$Bitcoin is trading in the low $63,000s, down from roughly $88,400 at the end of 2025 and far below the October 2025 peak near $126,000.
The technical picture is contested. Price is pressing against a descending trendline from that 2025 high, with all four weekly EMAs sloping downward overhead. The 20-week sits near $69,445 as the first real ceiling. On the downside, the $60,000 to $62,000 band has held through repeated tests since the June low and is the level bulls need to defend. Lose it, and the June low near $57,500 comes back into play.
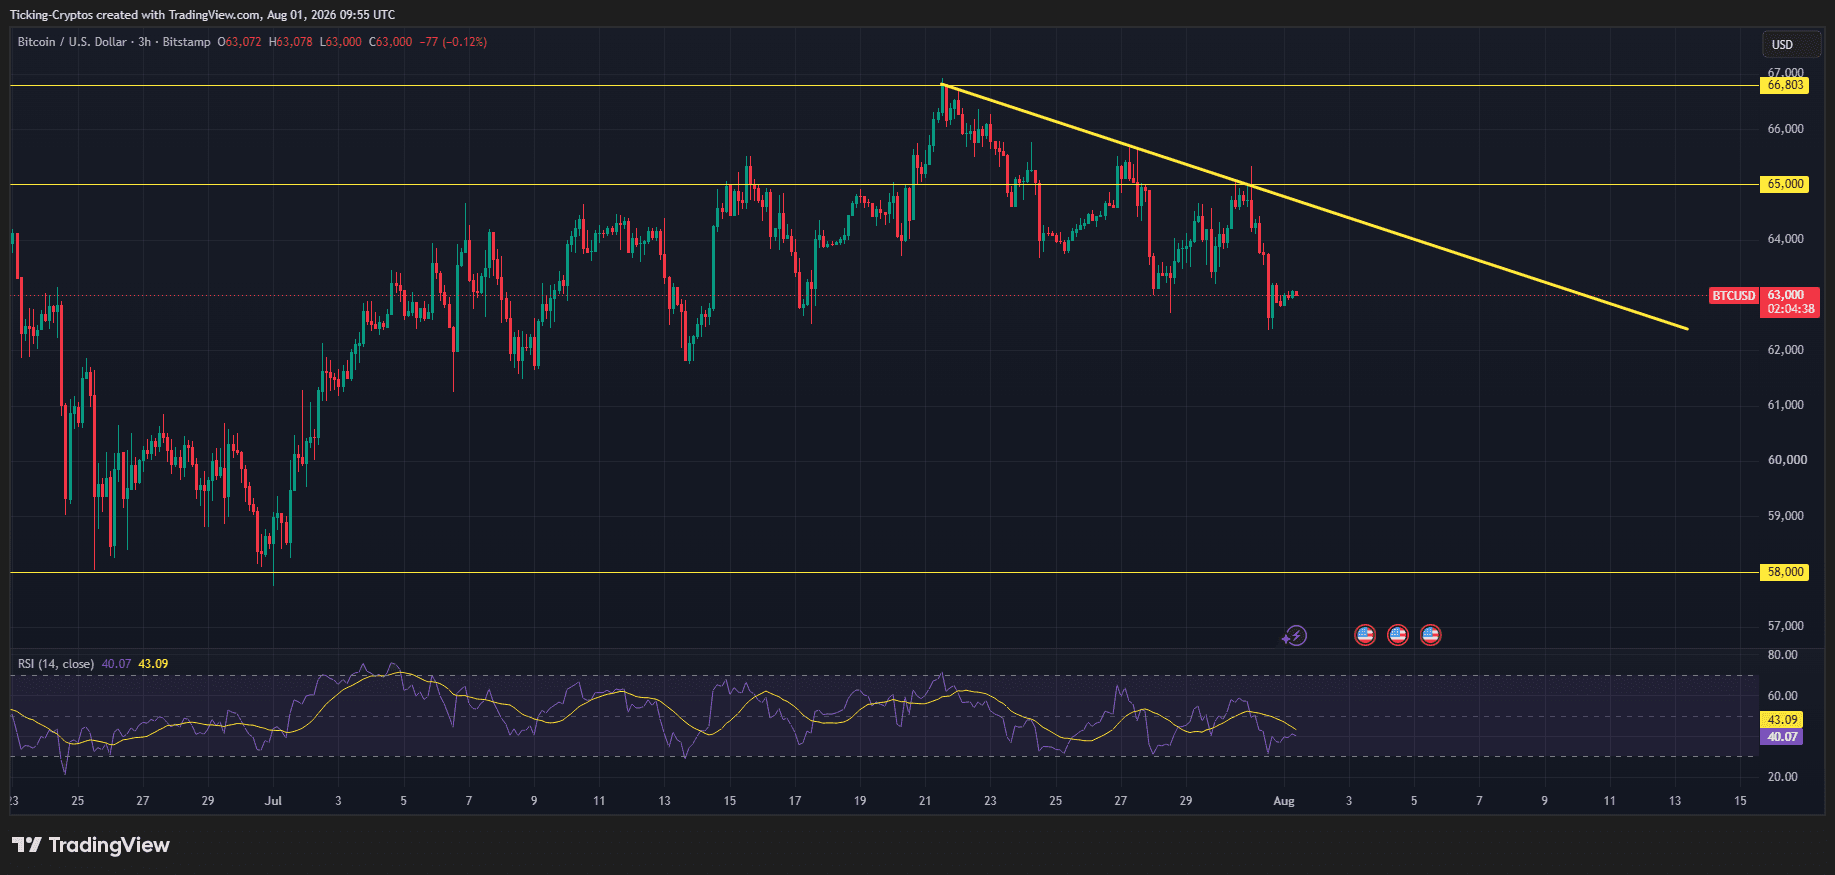
Seasonality is not on Bitcoin's side. July closed up around 9%, roughly in line with its historical average, but in the two most comparable bear-cycle years, 2018 and 2022, August erased those gains entirely.
The counterargument is that a restrictive Fed is now fully priced, ETF flows have shown signs of stabilising, and a weekly RSI divergence is flashing the opposite of what the macro tape suggests. Analysts looking at the same Fed decision have reached genuinely different conclusions, which is usually a sign the market is at an inflection rather than in a trend.