Key Highlights Bitcoin whales added exactly 16,010 BTC over 5 days as price fell from $87,000 toward $80,000 Whale holdings rose from 5,247,316 to 5,263,326 BTC (+0.305%) — per @alicharts on-
Key Highlights
Bitcoin whales added exactly 16,010 BTC over 5 days as price fell from $87,000 toward $80,000
Whale holdings rose from 5,247,316 to 5,263,326 BTC (+0.305%) — per @alicharts on-chain data
~800,000 BTC supply concentration at $84,569 is the key resistance zone before $89,000–$94,000
BTC trading at $83,332 (+0.44%) — directly beneath the densest cost-basis cluster on the URPD
Bitcoin is trading at $83,332 — up 0.44% in the past 24 hours, with a market cap of $1.67 trillion — and on-chain data reveals something significant happened while price was falling. As Bitcoin dropped from $87,000 toward $80,000, the largest holders on the network were not selling. They were buying.
On-chain analyst Ali Martinez (@alicharts) published a five-part thread on October 12, 2026, documenting the accumulation in precise terms: “As Bitcoin fell from $87,000 toward $80,000, whales added 16,010 BTC over five days. Their holdings rose from 5,247,316 to 5,263,326 BTC, representing a 0.305% increase while the price was declining.”
The whale cohort tracked by @alicharts refers to the largest on-chain Bitcoin holders — wallets with holdings large enough that their aggregate behavior reflects institutional or high-conviction positioning rather than retail sentiment. Over the five-day window as price fell from $87,000 toward $80,000, this group grew its collective holdings from 5,247,316 BTC to 5,263,326 BTC — a net addition of exactly 16,010 BTC.

Chart Analysis | Source: @alicharts (X)
The significance is in the direction. Price was declining. Retail-visible metrics — funding rates, social sentiment, exchange inflows — would have conveyed a bearish picture. Yet the on-chain record shows that the cohort most capable of moving markets was not waiting for confirmation. They were adding exposure into the drawdown. This pattern — large-holder accumulation during price weakness — has historically preceded sustained recovery moves in prior Bitcoin cycles, as documented in coverage of Bitcoin’s resilience through macro headwinds.
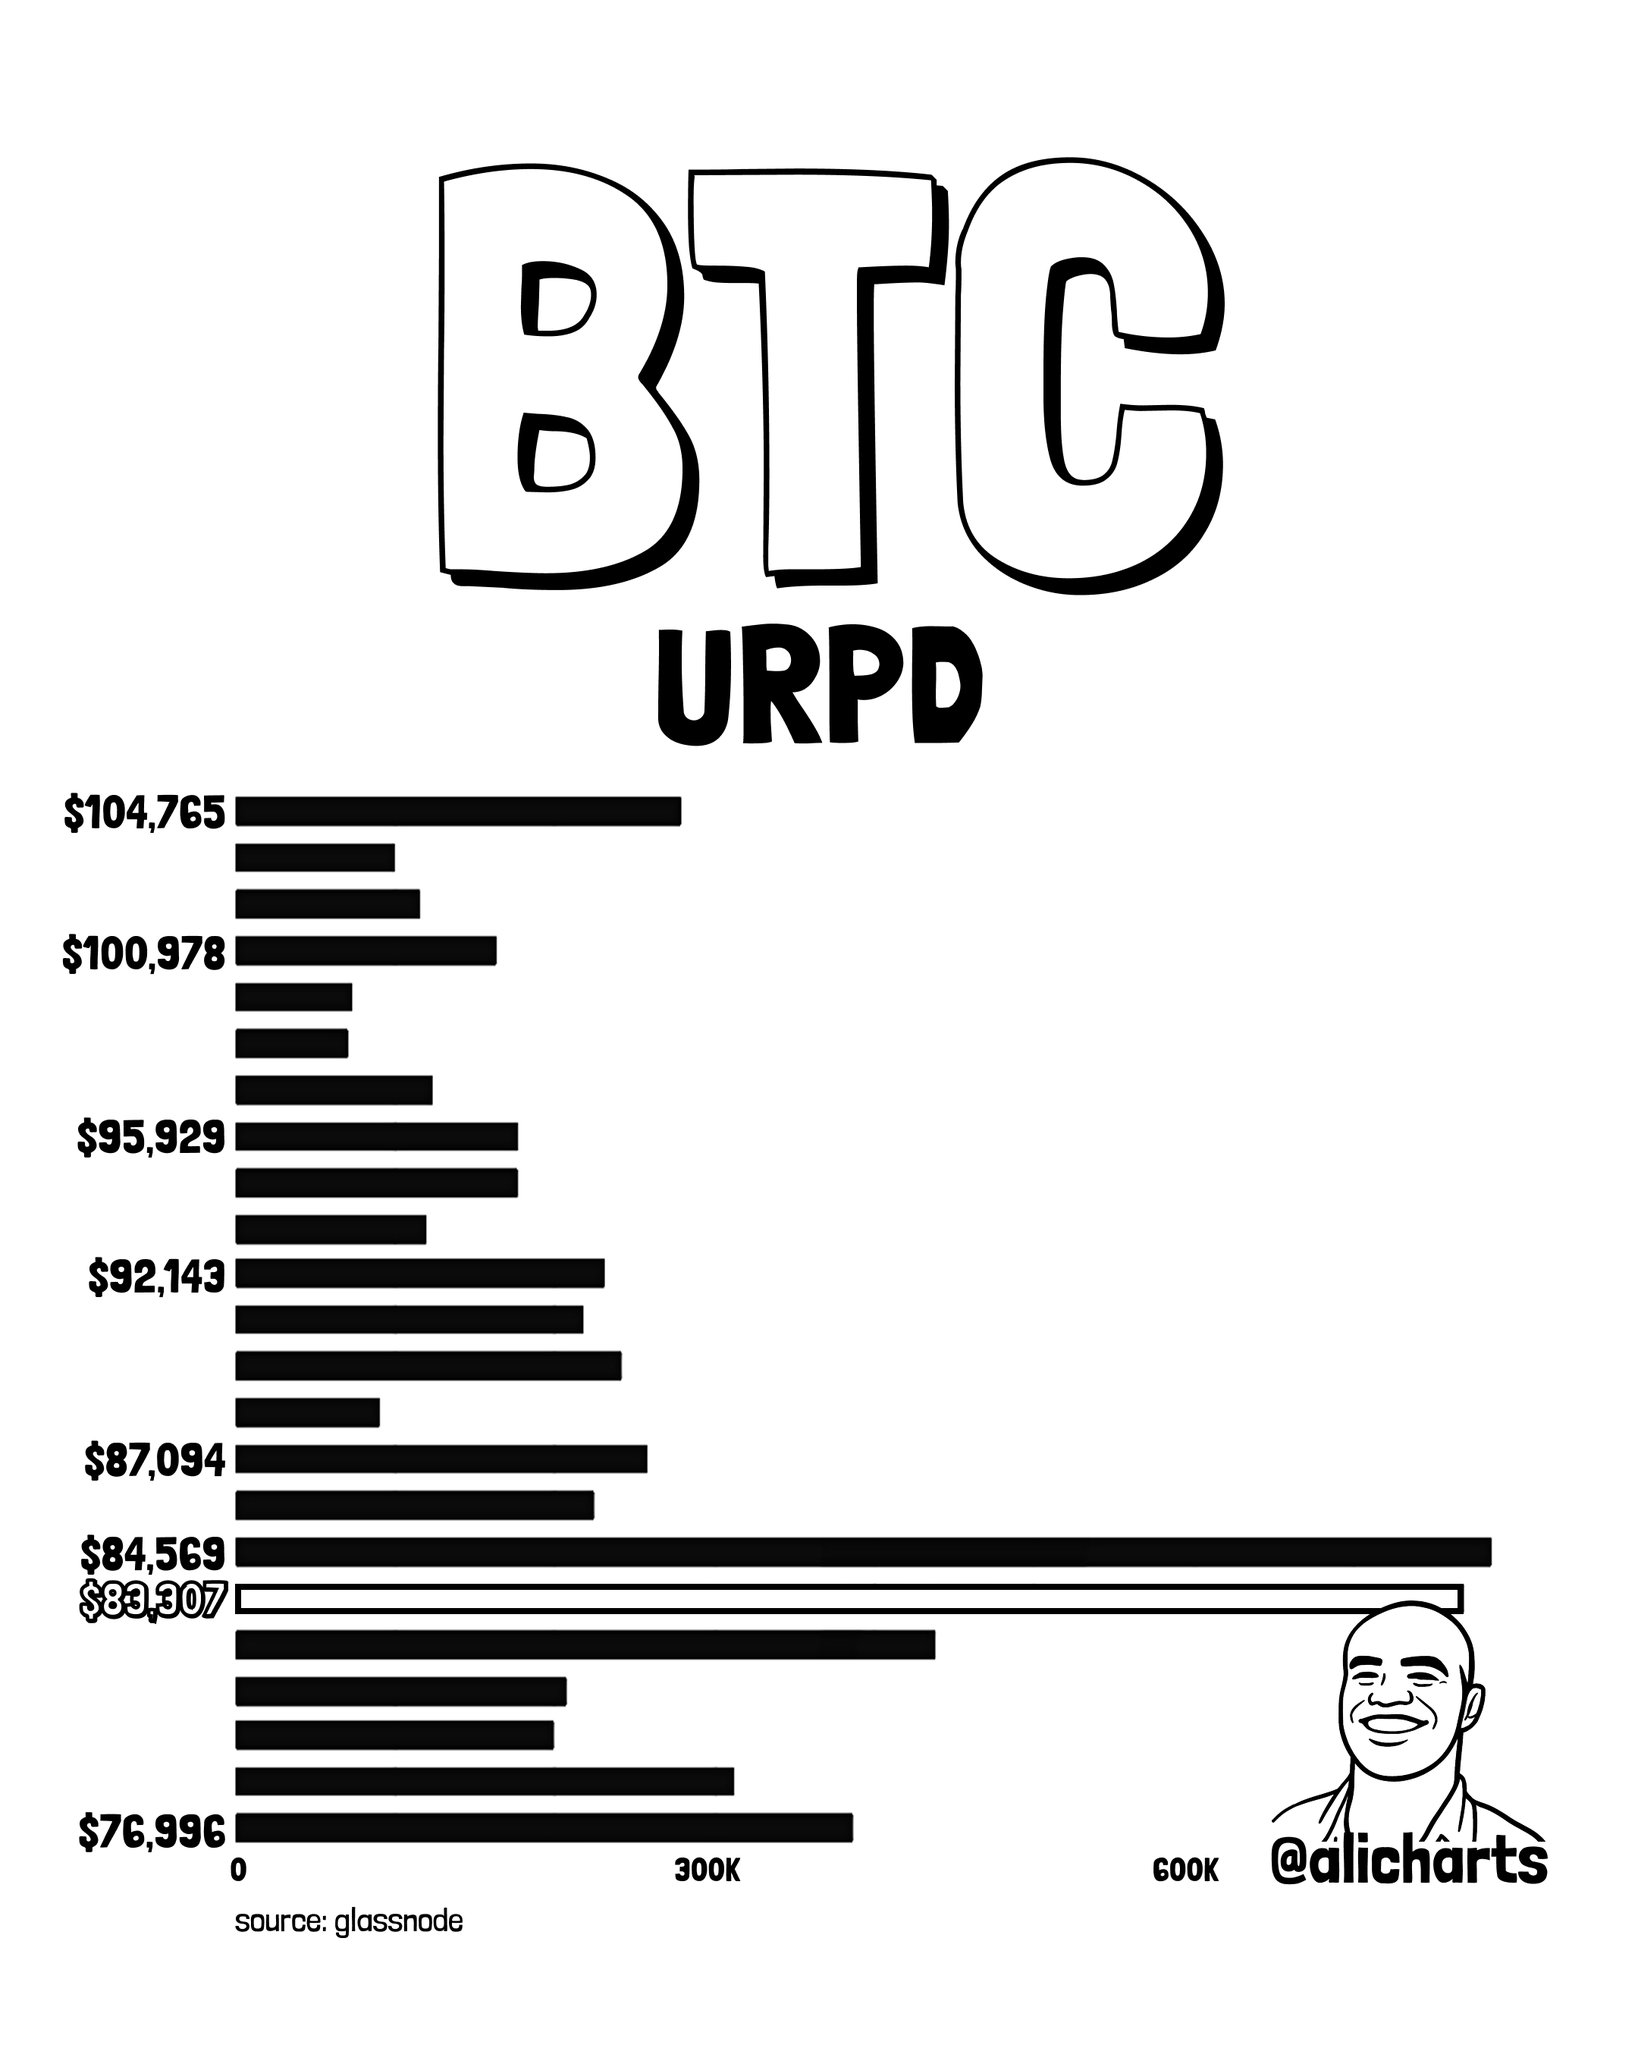
The accumulation data is bullish in isolation. But @alicharts is explicit that the case for a “next leg higher” is conditional, not confirmed. The URPD (Unspent Realized Price Distribution) data from Glassnode shows a dense concentration of approximately 800,000 BTC that were last transacted at approximately $84,569. This is the cost-basis cluster that defines where a large number of existing holders are currently near breakeven — and where selling pressure is most likely to emerge as price recovers.
Source: @alicharts (X)
The URPD chart shows two bars dramatically longer than all surrounding price levels — at $84,569 and $83,307 — both extending toward the 600,000 BTC range on the x-axis. Below $83,307, bar lengths decrease progressively toward $76,996. Above $84,569, bars thin out considerably until the $87,094–$92,143 range. The implication is structural: Bitcoin is currently trading at approximately $83,332, sitting directly beneath the densest supply concentration visible in the on-chain cost-basis map. A sustained move above $84,569 would require absorbing that supply — or seeing those holders hold rather than sell.
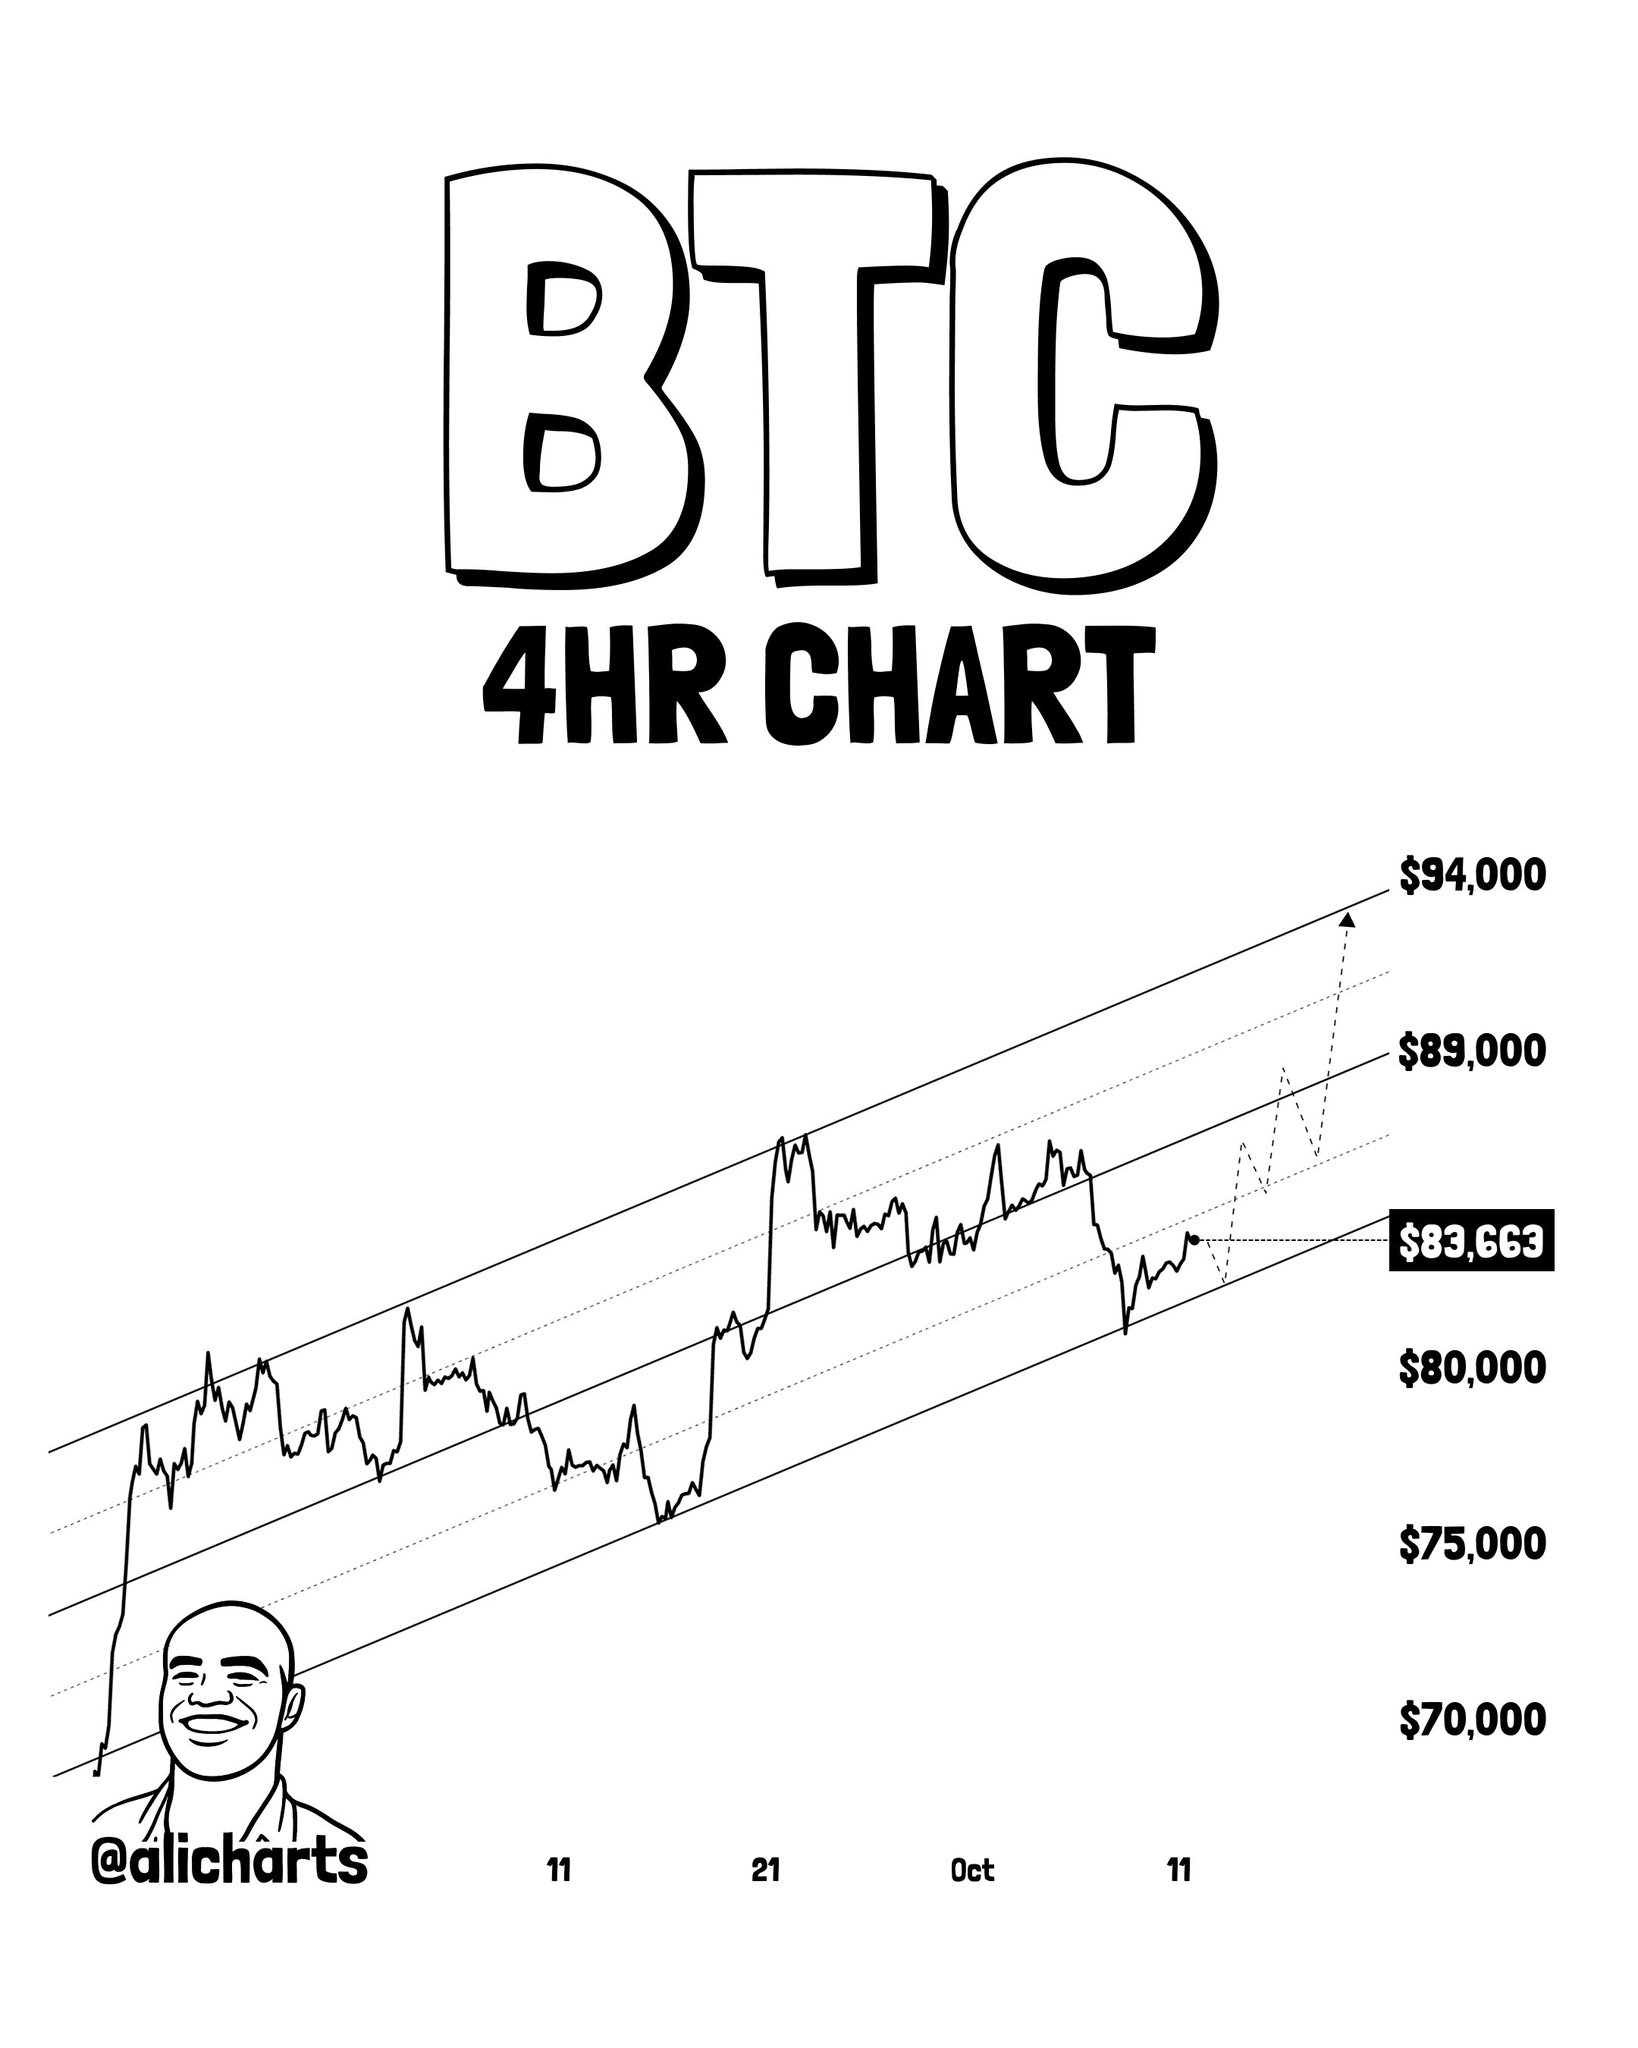
@alicharts also shared a 4-hour chart showing Bitcoin trading within a rising parallel channel. The chart labels two reference levels: $89,000 at the channel mid-range, and $94,000 near the upper boundary. A dashed projection line on the chart traces a potential bounce scenario from the current lower-channel support zone — labeled at $83,663 on the chart — rising first toward $89,000, then extending toward $94,000. These are the analyst’s upside markers contingent on the $84,569 supply zone being cleared.
Source: @alicharts (X)
The channel structure is relevant context for the whale accumulation data. If whales were building positions at current prices with awareness of the supply wall above, they are implicitly expressing conviction that $84,569 will eventually be absorbed — and that the channel’s upside targets represent reasonable forward expectations. Whether that conviction proves correct depends on whether buying pressure is sustained and whether the $84,569 zone is taken out on volume rather than stalled through it. This setup echoes the dynamics discussed in prior Bitcoin October bottom analysis from CryptoQuant.
The on-chain record is clear on one point: 16,010 BTC were added by large holders over five days during a price decline from $87,000 toward $80,000. That is a verifiable, timestamped fact from the on-chain ledger. What it does not confirm is the direction or magnitude of the move that follows. Accumulation into a dip establishes demand at lower prices — it does not guarantee that demand will overwhelm the supply overhead at $84,569.
The analyst’s framing — “the next leg higher starts now” — is a directional call contingent on the supply zone being resolved. The thread explicitly states that “a break above this supply zone would” be the prerequisite. Until Bitcoin closes above $84,569 with conviction, the accumulation data is a supportive condition, not a completed signal. Readers tracking Bitcoin’s evolving position in the current cycle can also reference the LTH-MVRV pattern analysis for additional structural context.
Bullish Scenario
Bitcoin sustains a break above $84,569, absorbing the ~800,000 BTC supply concentration. The rising channel then targets $89,000 at the mid-range, followed by $94,000 near the upper boundary — consistent with the analyst’s projected path. Continued whale accumulation above $84,569 would reinforce the thesis.
Bearish Scenario
Bitcoin fails to clear $84,569, and the supply wall turns price back. The URPD data shows thinner support below current levels, with the next visible concentration zone near $76,996. A rejection at the supply wall following the recent whale accumulation would represent a failed breakout attempt and reset the near-term structure.
The on-chain case is the strongest it has been during this drawdown: 16,010 BTC accumulated by whales over five days, whale holdings at 5,263,326 BTC, and a rising channel structure intact on the 4-hour timeframe. The single variable that determines whether this translates into a confirmed “next leg higher” is $84,569 — the level where ~800,000 BTC changed hands and where sellers will be waiting. Watch that level as the binary threshold between continuation and stall.
Disclaimer: The views and analysis presented in this article are for informational purposes only and reflect the author’s perspective, not financial advice. Technical patterns and indicators discussed are subject to market volatility and may or may not yield anticipated results. Investors are advised to exercise caution, conduct independent research, and make decisions aligned with their individual risk tolerance.
Also Read: ETH Liquidity on Binance Hits a 7-Month Low — A Supply Shock Building?