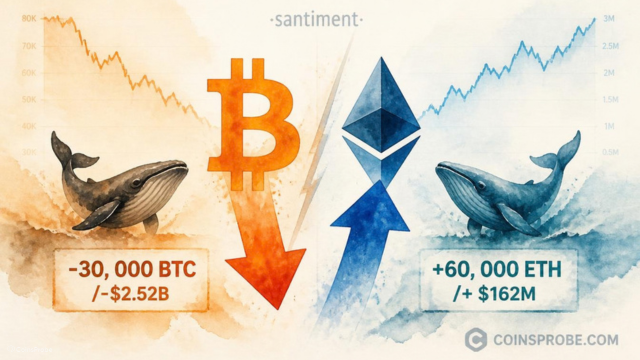
Key Highlights Bitcoin whales shed 30,000 BTC ($2.52B) between Sept 27–Oct 1 during sideways price action, per Santiment data via @alicharts Ethereum whales added 60,000 ETH (~$162M) over the
Key Highlights
Bitcoin whales shed 30,000 BTC ($2.52B) between Sept 27–Oct 1 during sideways price action, per Santiment data via @alicharts
Ethereum whales added 60,000 ETH (~$162M) over the same period — a direct divergence from BTC's distribution signal
Bitcoin whale holdings floor at 5.22M BTC — a break below confirms ongoing distribution; recovery above shifts thesis to accumulation
XRP whales stayed flat near 3.90 billion XRP over the past week.
Bitcoin is trading at $83,480 — up 0.57% in the past 24 hours — with a market cap of $1.676 trillion. But beneath the calm surface, a significant divergence is playing out between large holders across assets. While price moved sideways over the past week, whales were anything but idle.
Analyst Ali Martinez (@alicharts) published a five-part thread on October 1 tracking whale behavior across Bitcoin, Ethereum, and XRP during the recent lull. The headline finding: Bitcoin’s largest holders offloaded roughly 30,000 BTC — worth approximately $2.52 billion — while the market drifted sideways. Ethereum told the opposite story.
Santiment data tracked by @alicharts shows Bitcoin whale holdings peaked at approximately 5.26 million BTC between September 27 and 28, then dropped sharply through September 29, before stabilizing near a floor of 5.22 million BTC as October began. The 30,000 BTC reduction — valued at $2.52 billion at current prices — did not occur during a price crash. It occurred during sideways consolidation.
That distinction matters. Panic selling in a downturn reflects reactive behavior. Distribution into flat price action reflects something more deliberate. When price holds steady but whale holdings decline sharply, large holders are offloading into whatever retail liquidity exists — not reacting to a move, but engineering the conditions for one. The Santiment chart shared by @alicharts shows the classic cliff-edge structure: a steep drop in holdings from Sept 27–29, followed by slight stabilization into October 1.
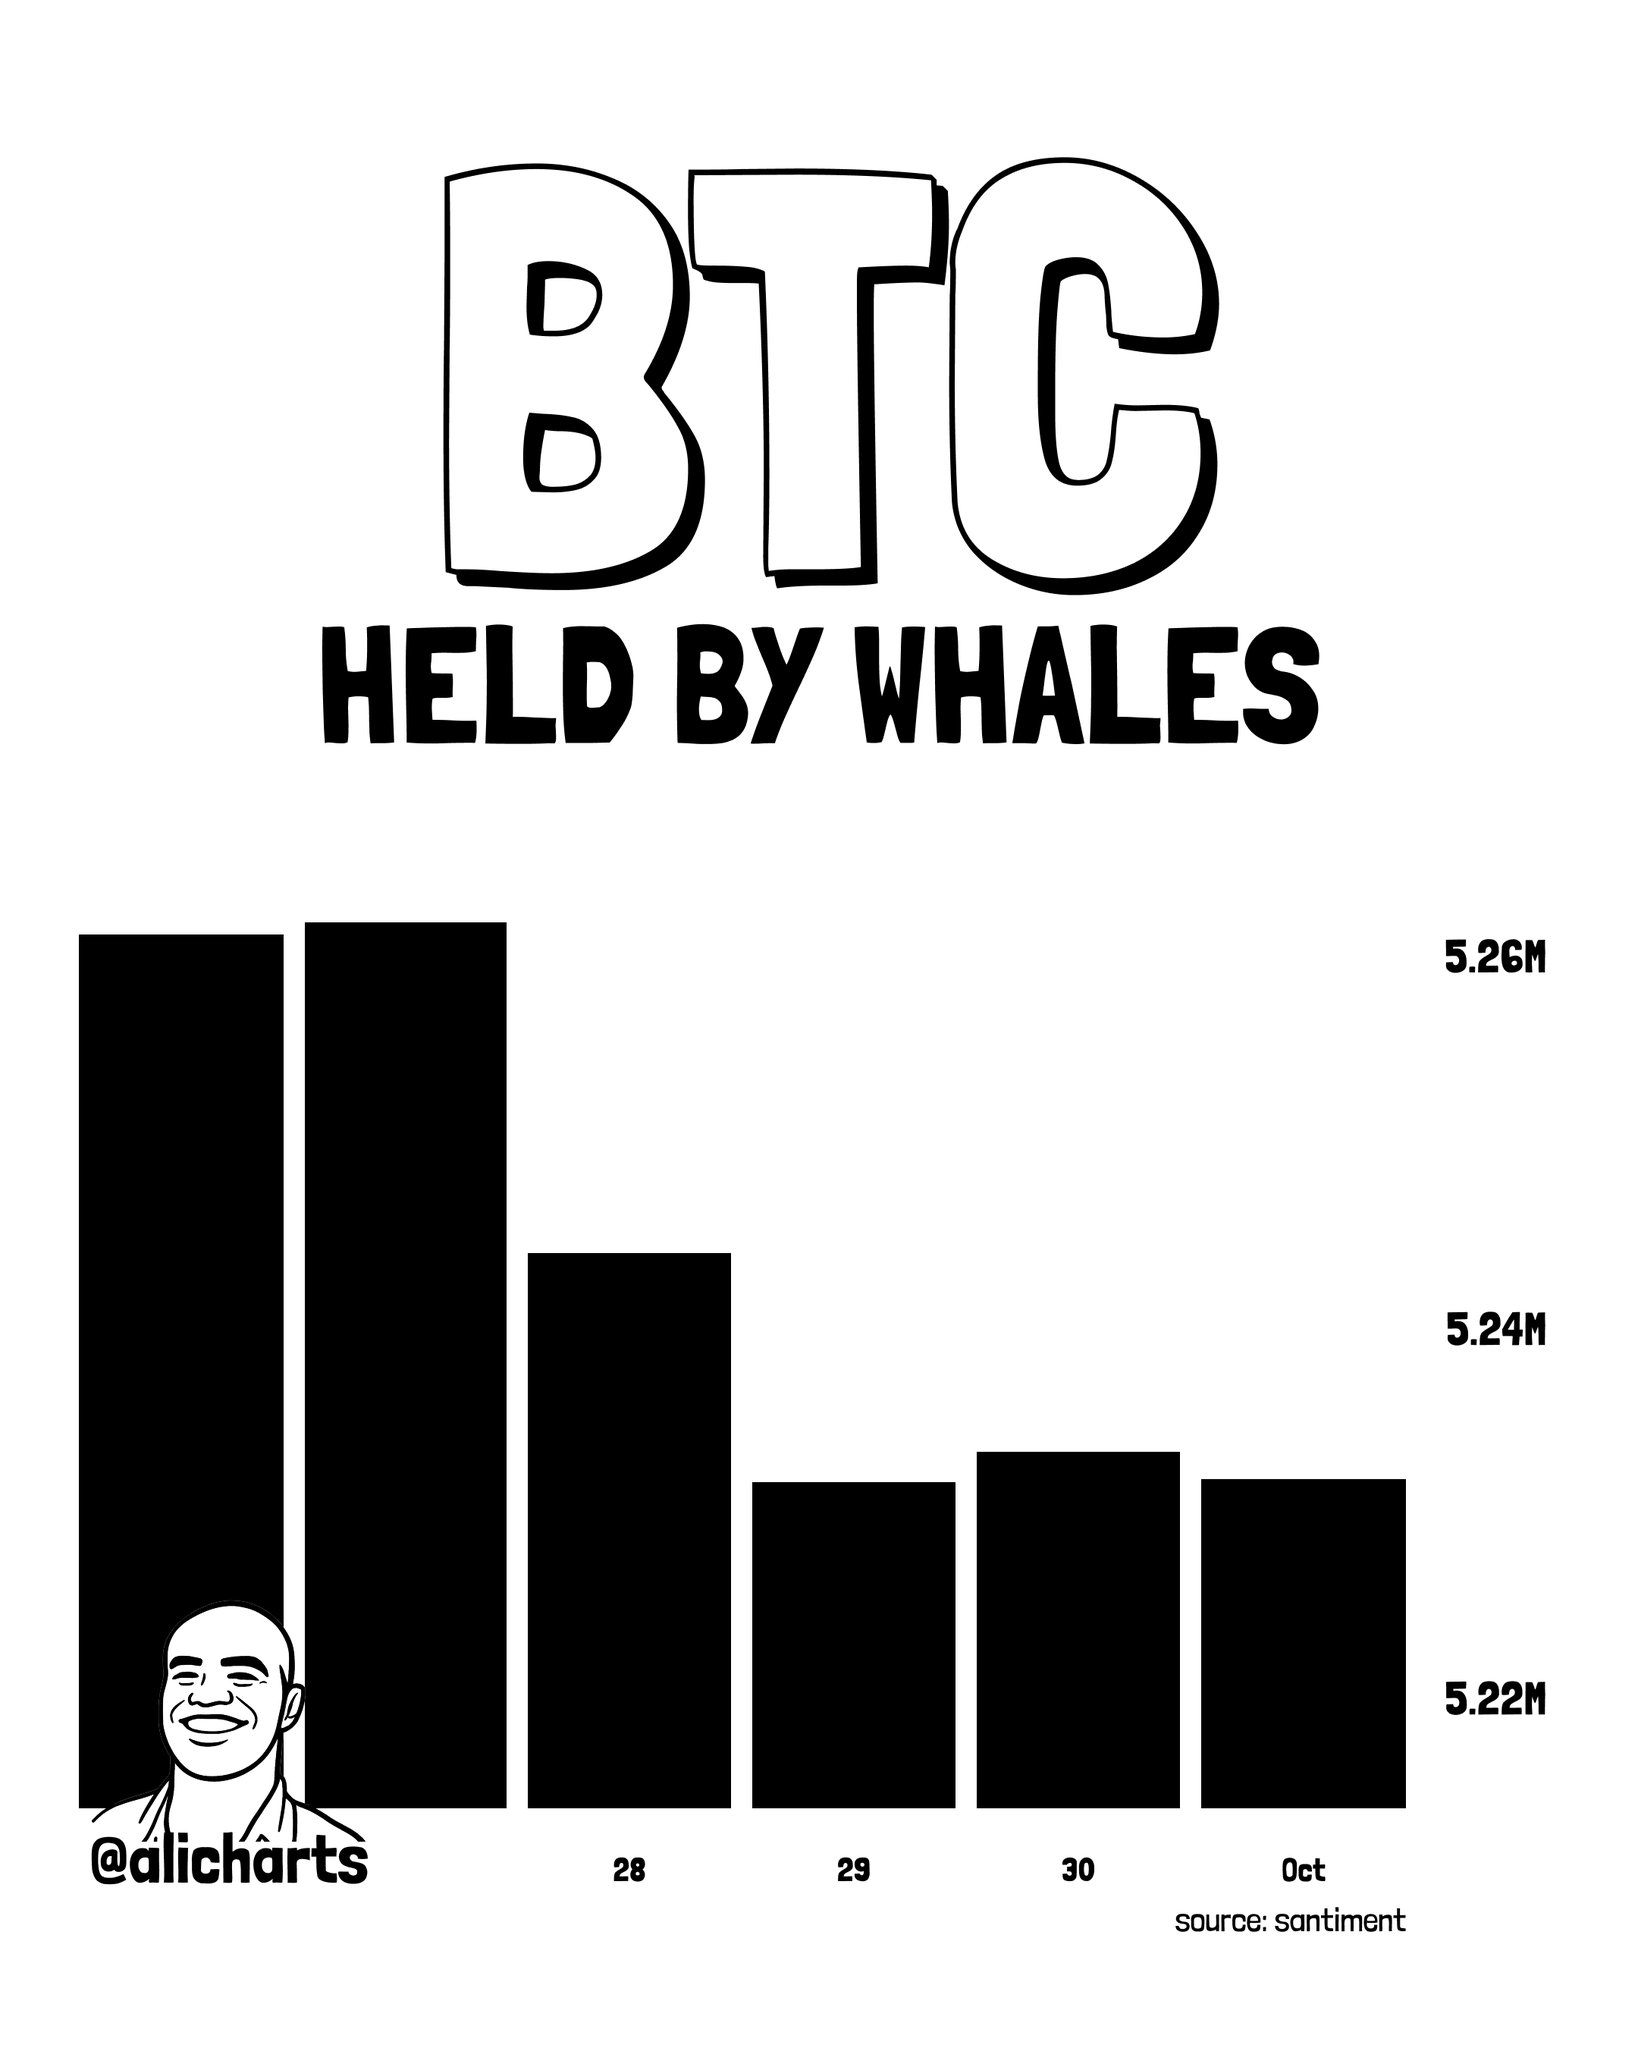
BTC Held by Whales — Analysis | Source: @alicharts (X)
The slight recovery in holdings into October bears close watching. If Bitcoin whale balances stabilize or reverse higher, it may signal accumulation resuming at lower realized prices. If holdings continue declining, the 30,000 BTC already distributed represents supply that the market must now absorb — a structural headwind that price pressure typically follows, not precedes. Bitcoin’s sideways action over the past week may already reflect this dynamic: the market absorbing supply without large buyers stepping in at scale.
This pattern is not isolated to Bitcoin. As noted in our earlier coverage, ADA futures open interest fell 9% as whales offloaded $22.5M in a single week — a sign that large-holder distribution has been a cross-asset theme in recent sessions.
Ethereum’s whale data runs directly counter to Bitcoin’s. Over the same week, ETH large holders added approximately 60,000 ETH — worth around $162 million. Where Bitcoin whales distributed into the lull, Ethereum whales used the same flat market to accumulate. The divergence is notable precisely because the macro backdrop was identical for both assets: a sideways, low-volatility week with no major directional catalyst.
The contrast suggests asset-specific conviction rather than a macro risk-on or risk-off position. Ethereum whales were not buying because the market was bullish — they were buying during a period when Bitcoin whales were selling. For context, the scale of ETH accumulation (Ethereum whale transactions have surged in recent weeks) points to deliberate positioning rather than routine rebalancing.
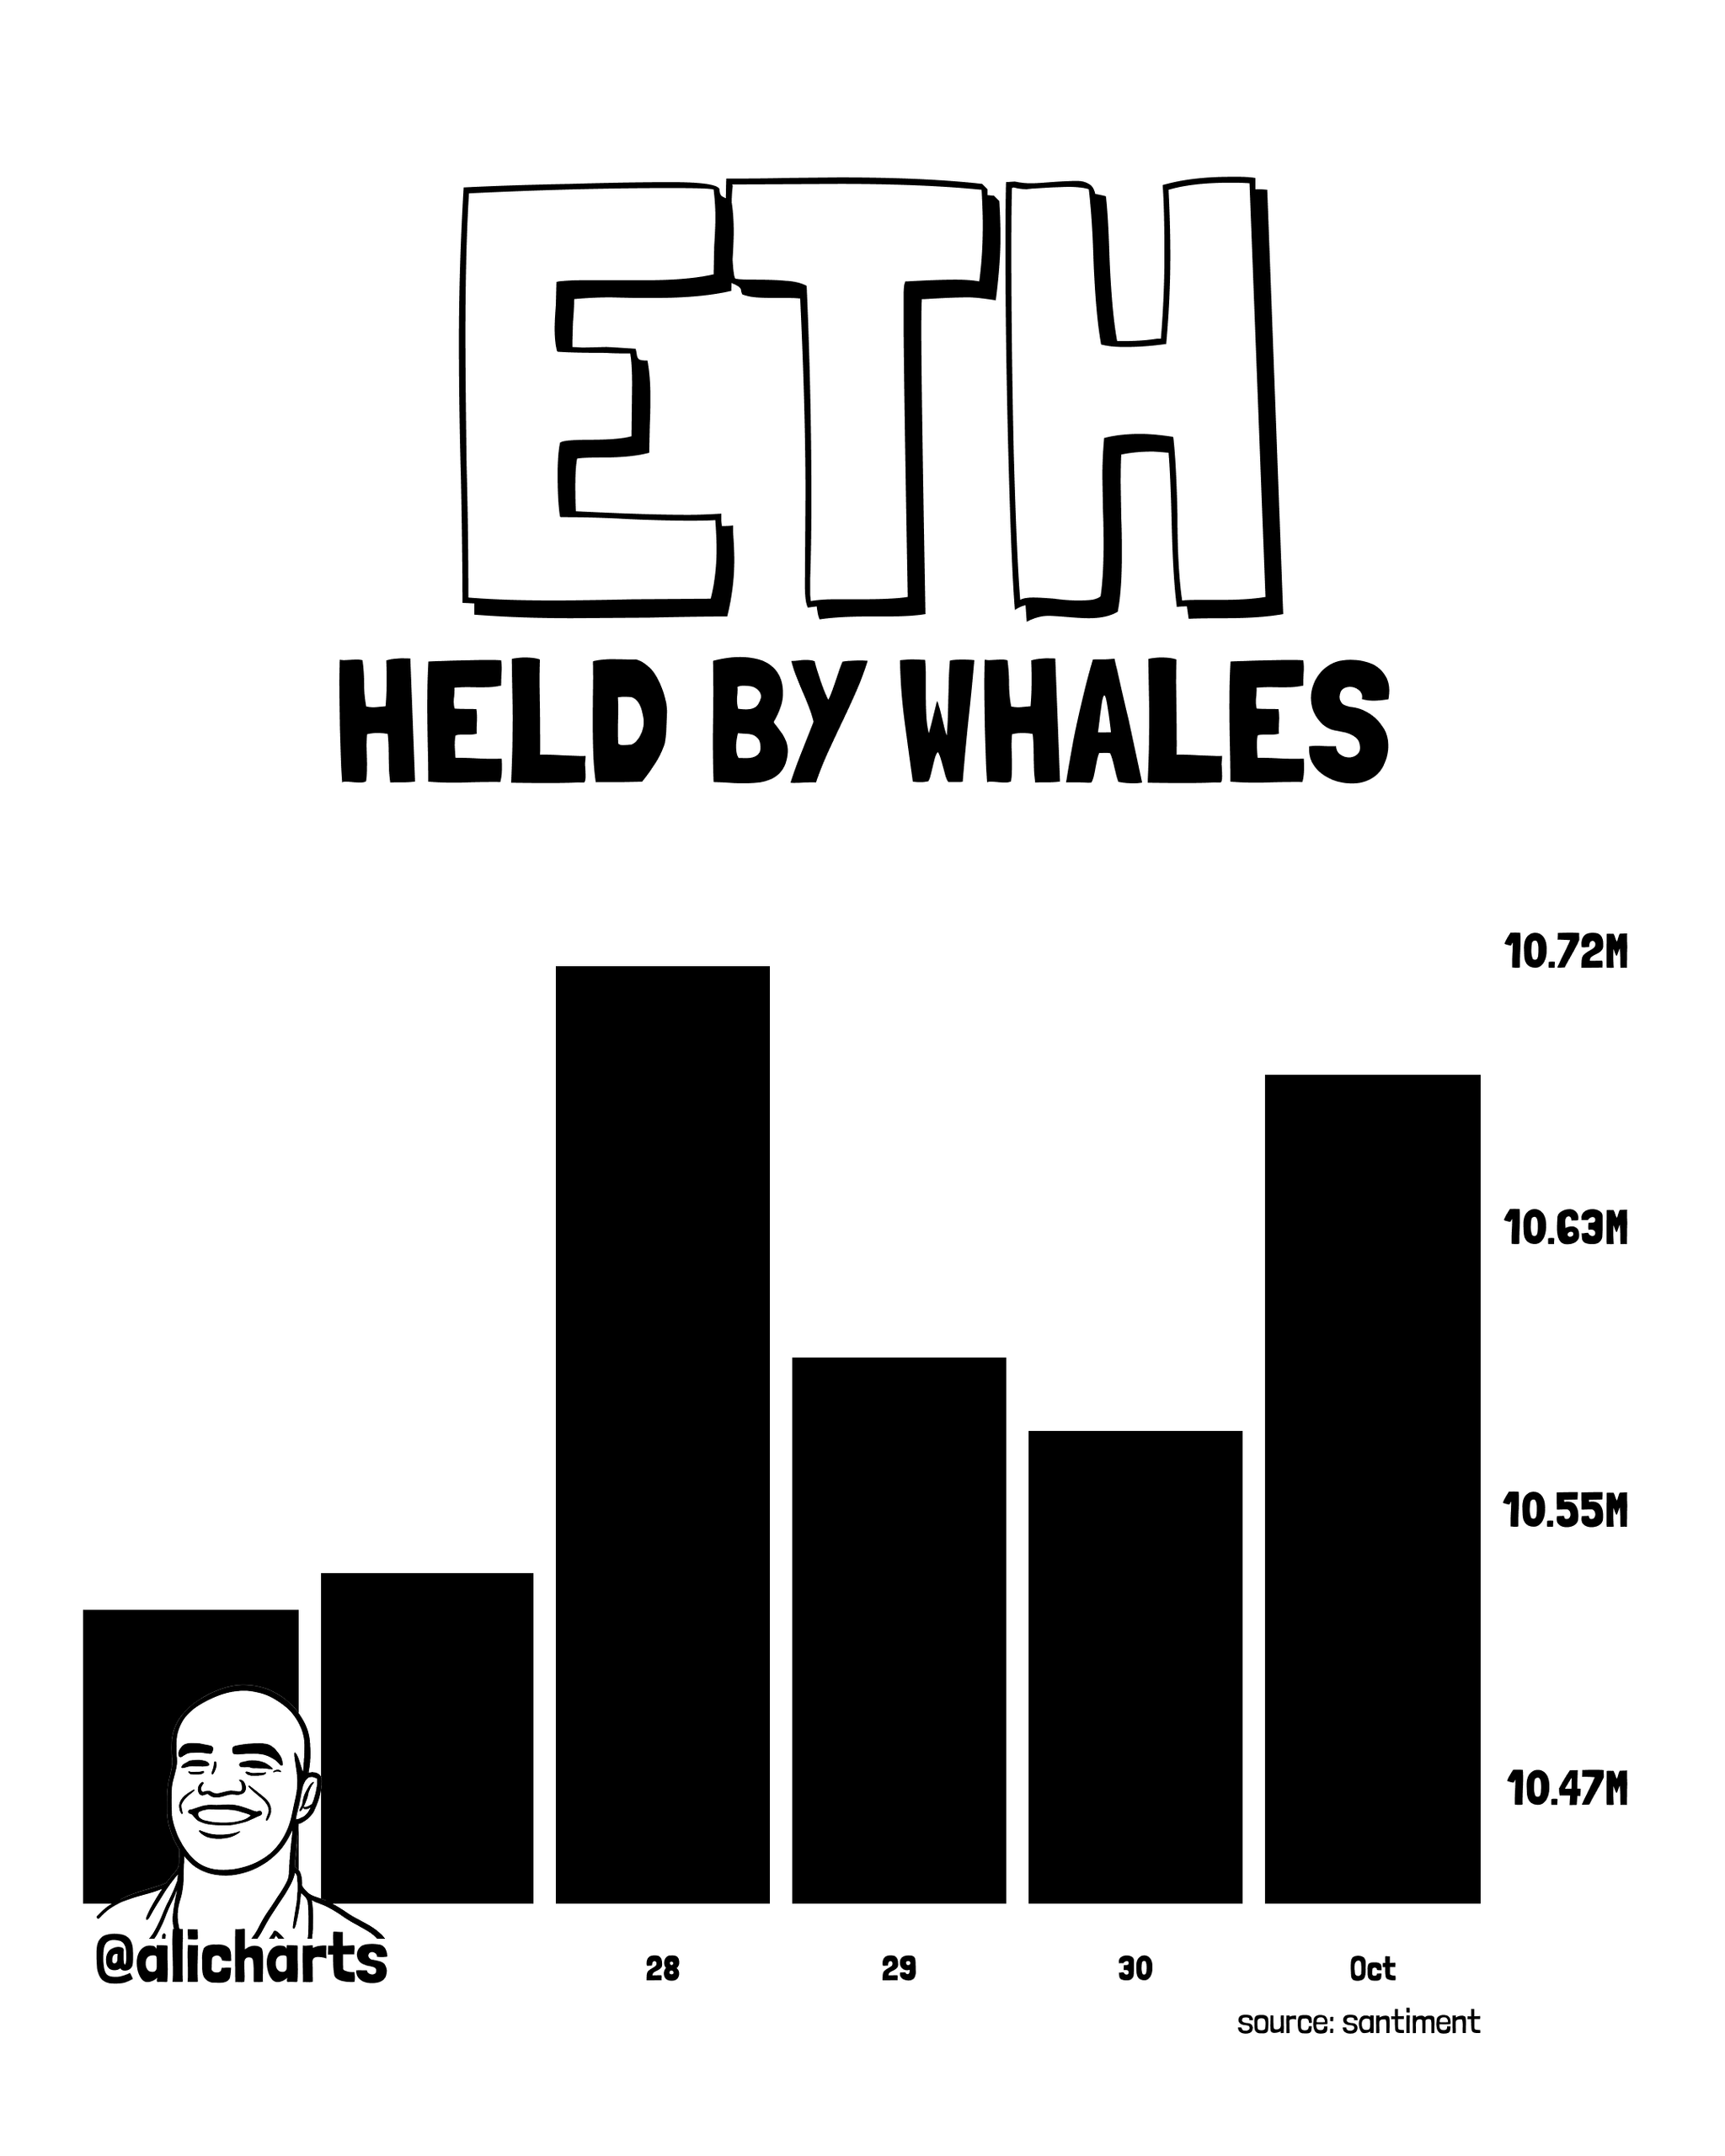
ETH Held by Whales | Source: @alicharts (X)
The mechanism behind quiet distribution is straightforward. In a falling market, retail participants reduce exposure alongside whales — meaning there is less liquidity for large holders to sell into without moving price. In a sideways market, retail sentiment is neutral and passive buyers remain present. That liquidity allows whales to exit at scale without triggering the price decline that would otherwise reveal their selling. The result: holdings fall, price holds, and the structural imbalance builds until retail buying is exhausted.
This is why the Santiment data flagged by @alicharts is more consequential than a sharp single-session dump. A 30,000 BTC reduction across four days of flat price action implies that the selling was absorbed — meaning the supply overhang has already entered the market. The question now is whether demand at current levels is sufficient to prevent further drawdown once that absorption is complete.
Bullish Scenario — Whale Holdings Stabilize Above 5.22M BTC
If Santiment data shows Bitcoin whale balances recovering above 5.22 million BTC in the sessions ahead, it would indicate the distribution phase has ended and large holders are re-accumulating at current levels. A confirmed reversal in whale holdings, combined with price holding above $83,000, would shift the structural picture from distribution to accumulation — opening a path toward retesting the $88,000–$90,000 resistance zone.
Bearish Scenario — Holdings Continue Declining Below 5.22M BTC
If whale holdings break below the 5.22 million BTC floor identified on the Santiment chart, it confirms that distribution is ongoing rather than complete. The 30,000 BTC already sold represents $2.52 billion in supply that the market has absorbed — additional selling would add to that overhang. In this scenario, the sideways consolidation becomes a distribution top rather than a base, and Bitcoin’s next directional move would likely resolve to the downside. The $80,000 level becomes the immediate support to watch.
@alicharts’ fourth update fills in the XRP side of the divergence. While Bitcoin whales cut about 30,000 BTC, worth roughly $2.52 billion, and Ethereum whales added about 60,000 ETH, worth around $162 million, XRP whales largely stayed put. Combined holdings hovered around 3.90 billion XRP over the past week, with no significant change.
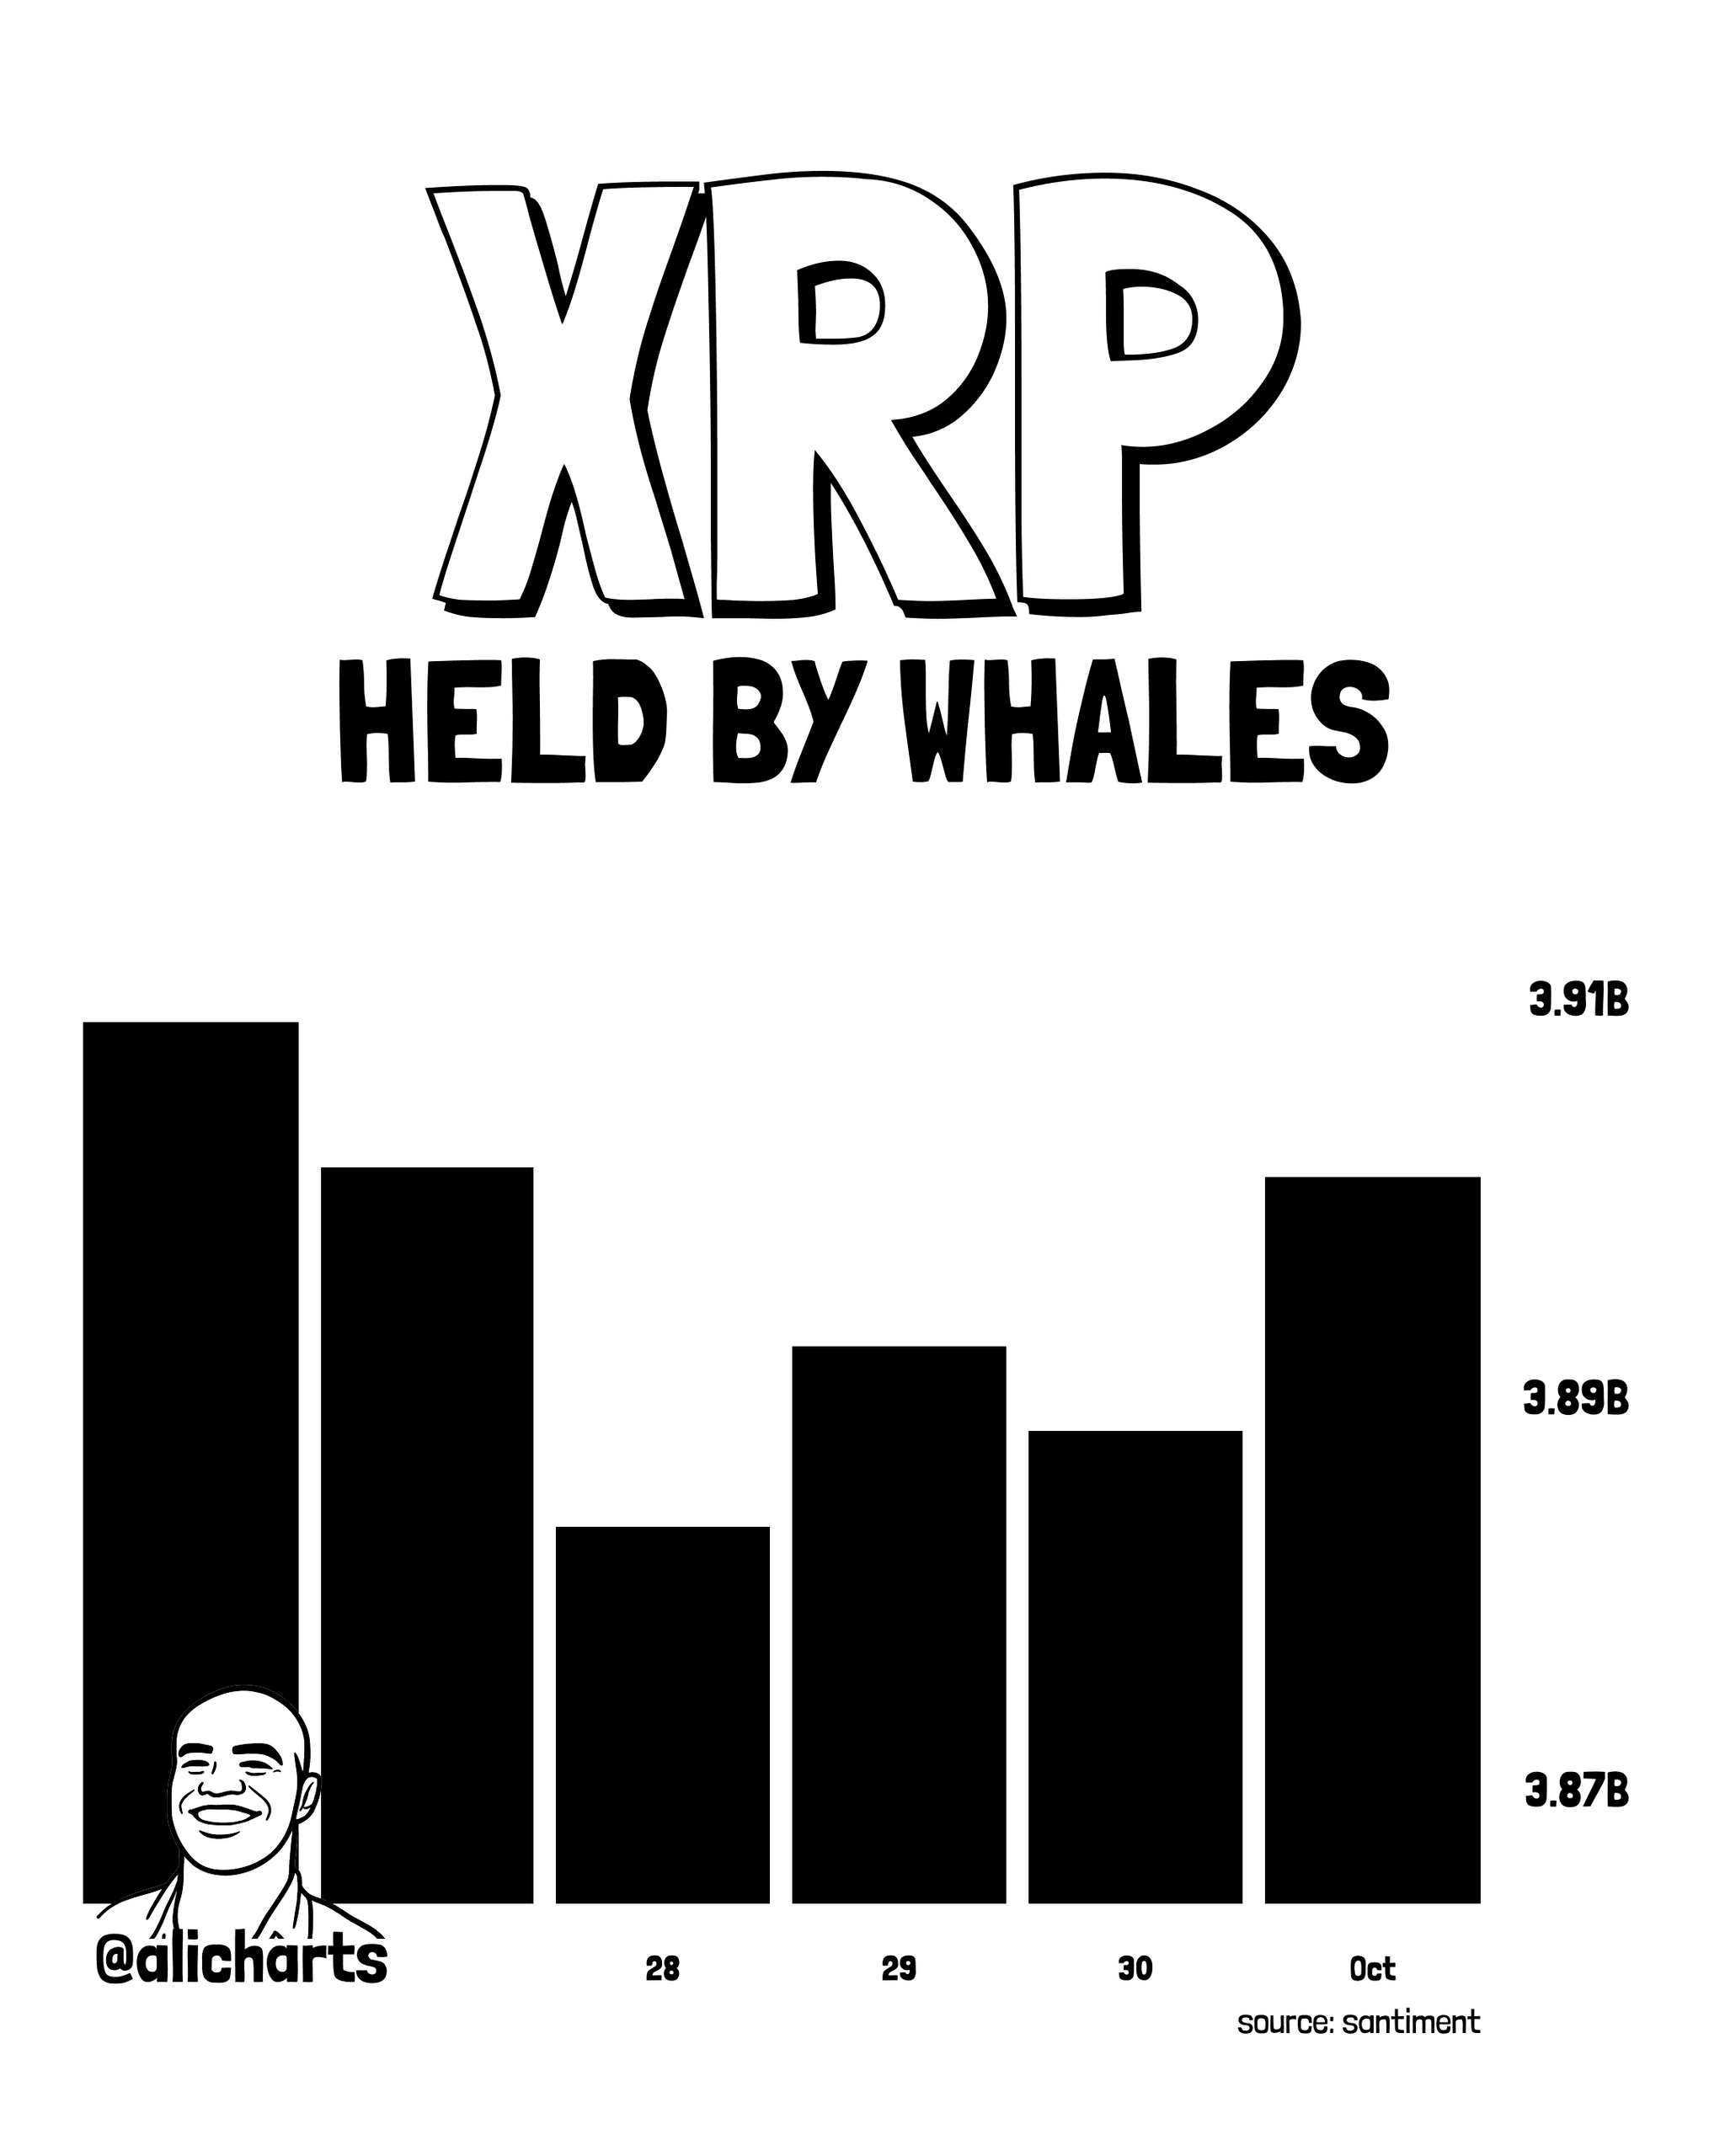
XRP Held by Whales | Source: @alicharts (X)
That leaves a three-way split, not a clean rotation from Bitcoin into altcoins. Bitcoin’s largest holders reduced exposure during a flat week. Ethereum’s largest holders added. XRP’s largest holders waited. Ali’s own summary is the same: Bitcoin whales are reducing holdings, Ethereum whales are buying, and XRP whales are waiting.
The split is asset-specific. It does not show XRP whales following Bitcoin’s distribution or matching Ethereum’s accumulation. Santiment’s Bitcoin whale-holdings chart remains the metric to track on the BTC side: a continued decline below 5.22 million BTC confirms ongoing distribution, while a recovery above that floor would weaken the selling thesis. If Bitcoin whale selling continues, $80,000 is the level where absorption will be tested.
The full picture from @alicharts’ thread will clarify whether XRP whales are following Bitcoin’s distribution pattern or Ethereum’s accumulation signal.
The core takeaway from the data is structural. Bitcoin’s largest holders reduced exposure by $2.52 billion during a week when price gave no obvious reason to sell — which is precisely when informed selling happens. Ethereum’s largest holders added $162 million over the same period into the same flat market. The divergence points to asset-specific conviction at the institutional level. Santiment’s whale holdings chart is the metric to track in real time: a continued decline below 5.22 million BTC confirms ongoing distribution; a recovery above that floor shifts the thesis. Watch $80,000 as the level where absorption capacity will be tested if whale selling continues.
Disclaimer: The views and analysis presented in this article are for informational purposes only and reflect the author’s perspective, not financial advice. Technical patterns and indicators discussed are subject to market volatility and may or may not yield anticipated results. Investors are advised to exercise caution, conduct independent research, and make decisions aligned with their individual risk tolerance.
Also Read: Bitcoin MVRV Z-Score Holds Above 365-Day Average — Structure Still Favors Upside.