Why would a small DePIN token jump 16.2% on a day Bitcoin loses 8.9%? That gap sits at the center of this Bless price prediction, and it picks up wherethat $0.0200 rejection ended on Nov 17.
Why would a small DePIN token jump 16.2% on a day Bitcoin loses 8.9%?
That gap sits at the center of this Bless price prediction, and it picks up wherethat $0.0200 rejection ended on Nov 17.
Four days later, buyers are back near $0.01395. Whether they stay is the real question.
Bless Price Prediction Data Snapshot
At 04:54 UTC on Nov 21, 2026, BLESS trades at $0.01395, up 16.2% in 24 hours, perCoinGecko market data. It ranks 608th.
Market cap, meaning price times circulating coins, is $25.871M. FDV, the value if all 10B coins existed, is $140.478M.
24h volume is $6.679M. The 24h range runs from $0.01141 to $0.01448, and the 7-day range stretches from $0.008085 to $0.01943.
And the price still sits 93.5% below the all-time high of $0.2181.
BLESS vs. Bitcoin Relative Strength Check
Anyone following theBitcoin price prediction knows the tape is ugly. Bitcoin trades at $56,240.62, down 8.9% on the day and 16.2% over 7 days.
Ethereum is down 10.1% at $1,560.17. Total crypto market cap fell 5.2% to $2.095T.
Against that, BLESS vs. Bitcoin shows a 28.8% gain on the BTC pair.
But the Fear and Greed index sits at 11, extreme fear, so buyers are scarce everywhere. BLESS still trades 72.5% above its 7-day low.
That's real relative strength, and it lifts this Bless price prediction above a plain bounce story. So who is actually buying?
Futures vs. Spot Volume in BLESS Trading
Futures volume, meaning leveraged contracts, is $193.74M against $4.17M in spot, where real coins change hands. That's 46.5 times more, perCoinGlass futures data.
Leverage is cooling, though. On Nov 17, the ratio stood at 86.5 times.
BLESS open interest, the total value of open contracts, is $37.67M, up 8.93%.
BLESS funding rate, the fee for long and short swaps every 8 hours, flipped. From -0.0134% on Nov 17 to +0.0134% now.
Taker ratios, which compare market buys to market sells, sit under 1 on Binance and Gate at 0.9514 and 0.9683. And spot net inflow is -$20.1K.
Exchange Flow Split Between Binance and MEXC
Binance leads futures volume at 113.89M, up 179.5%. Net flow, buy pressure minus sell pressure, is -2.83M there. Sellers pressed harder on the biggest venue.
MEXC tells another story. Open interest fell 20.6% to 6.87M, yet net flow is +712.53K.
Aster adds +1.04M, and Hot Coin adds +676.21K. Total net flow still lands at -$674.55K.
Venue changes can swing liquidity fast, soexchange listing updates matter here.
BLESS Technical Analysis on the Daily Chart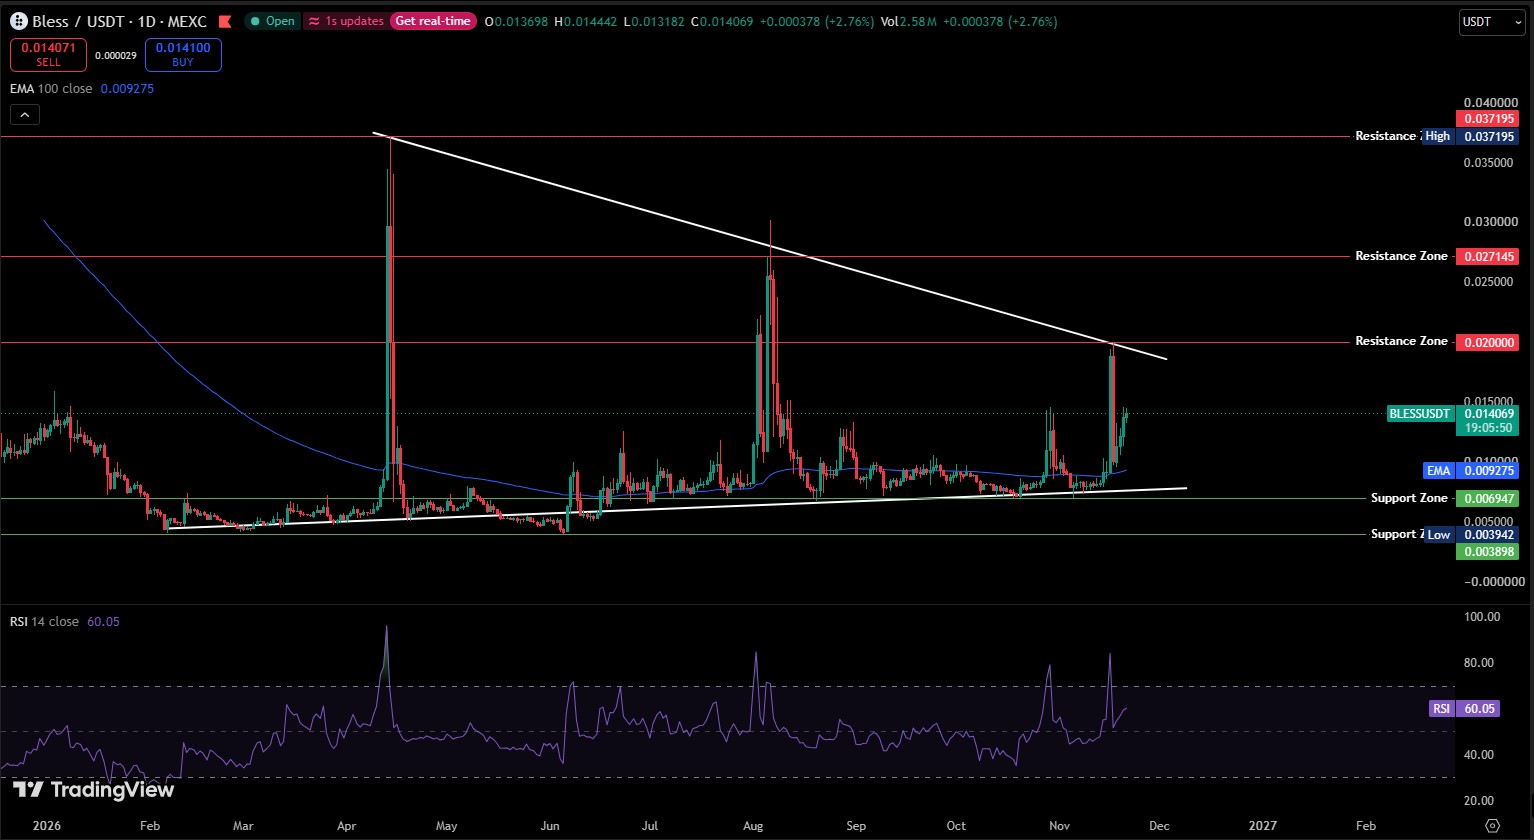
Three Spikes and Three Lower Highs
BLESS technical analysis starts with a slide into the $0.0040 area. Price then spiked to $0.037195 on the TradingView daily chart of BLESS/USDT on MEXC and gave most of it back.
A second spike topped near $0.0302. Then the third spike. It reached $0.0200 and touched the falling trendline, a line joining lower highs.
Resistance, where sellers cap rallies, fell from $0.037195 to $0.0200 across 3 spikes. Support, where buyers step in, rose near $0.006947, and that squeezes the price into a triangle.
RSI peaked near 96 on the first spike and near 85 on the latest. Each peak came at a lower price.
Rebound From the 100 EMA
Price then dropped to the 100 EMA at $0.009275. The 7-day low of $0.008085 dipped under it before buyers stepped back in.
BLESS now trades at $0.014069, up 2.76% on the daily candle, with RSI at 60.05. That's 51.7% above the 100 EMA and nowhere near overbought.
That looks like a breakout starting. A breakout needs a daily trade above $0.0200.
Who Holds the Supply
The top 10 wallets hold 92.01% of 9,999,962,876 tokens, per theSolscan holder list. Only 5,747 holders exist in total.
Labeled Squad Vault wallets add up to 58.36%, led by one at 30%. The other 5 top wallets carry 33.65%.
BLESS Support and Resistance Levels
BLESS support and resistance starts overhead. $0.0200 sits where the falling trendline meets the first resistance zone, then $0.027145 and $0.037195.
Theearlier Bless rally topped out between $0.0273 and $0.0302, so $0.027145 is the first stop on that map.
Floors sit at $0.01141 (the 24h low), $0.009275, $0.006947, and $0.003898.
Bless Price Forecast Scenarios
This Bless price forecast leans bullish above $0.01141, but confirmation needs $0.0200.
Scenario
Trigger
Target
Invalidation
Liquidity Condition
Bull
Daily trade above $0.0200
$0.027145, then $0.037195
Back under $0.0200
Spot volume rising
Base
Range $0.01141 to $0.01943
$0.01448, then $0.01943
Trade under $0.01141
Futures lead, spot flat
Bear
Daily trade under $0.009275
$0.006947, then $0.003898
Back above $0.009275
Longs liquidated, funding negative
As a Bless DePIN token, BLESS can react to infrastructure headlines, soAI crypto news deserves a scan.
Risks That Could Change the Bless Price Outlook
Spot volume is $4.17M against $193.74M in futures. A single forced wave of selling moves a market that thin.
The Bless price prediction turns bearish under $0.009275. And a $706.42K liquidation day, 64% longs, shows how fast leverage unwinds.
Holder concentration adds a second layer, covered in theBless whale concentration study.
Final Takeaway
The Bless price outlook stays bullish while BLESS trades above $0.01141 and the 100 EMA at $0.009275. This BLESS price analysis needs a daily trade above $0.02 before calling a breakout. Traders comparing setups can browseother crypto price predictions.
Disclaimer: This article is for information only and isn't financial advice. Crypto prices swing fast, and BLESS is a small-cap token with thin spot liquidity. Research before trading and never risk money .