BNB Chain Just Overtook Hyperliquid in Daily Revenue BNB Price A Quiet Milestone Just Landed That Matters More Than Today's Price Move BNB is trading in a fairly wide band today, June 24, 202
BNB Chain Just Overtook Hyperliquid in Daily Revenue
BNB Price A Quiet Milestone Just Landed That Matters More Than Today's Price Move
BNB is trading in a fairly wide band today, June 24, 2026—different trackers show anywhere from $578 to $592, depending on the exact snapshot, with the past week showing a decline of roughly 1.5% to 5.9% and the past month down 8% to 11%.
None of that is dramatic on its own. What's actually interesting today is a data point that slipped past most headline coverage: BNB Chain has overtaken Hyperliquid in daily on-chain revenue, according to Elfa AI's tracking, published just a few hours before this report.
That's a genuinely notable shift. Hyperliquid has been one of the fastest-growing perpetual-trading chains in crypto through 2025 and into 2026, and revenue leadership in that specific category has been treated as a bellwether for where serious trading volume is migrating.
BNB Chain reclaiming that position—even temporarily—says something concrete about real platform usage that a single day's price chart doesn't capture.
Meanwhile, Binance itself made a smaller, more mechanical announcement that's worth knowing if you hold any of the affected pairs: ME/USDC, NOT/FDUSD, and several other spot trading pairs are being removed on June 26, just two days from now.
This is a routine liquidity-management decision rather than a BNB-specific event, but it's the kind of housekeeping news that shapes which assets get attention on the exchange in the days ahead.
Live Market Data — June 24, 2026
Metric
Value
Source / Notes
Current Price
~$578 – $592
Range across CoinGecko, TradingView, Investing.com snapshots
24h Trading Volume
$670M – $902M
CoinGecko / TradingView aligned
Market Cap
~$77.2 – $79.7 Billion
CoinMarketCap / CoinGecko rank #4
7-Day Change
-1.46% to -5.86%
Mild to moderate pullback depending on source
30-Day Change
-8% to -11.32%
Continued correction from earlier-year highs
1-Year Change
+4.57%
Investing.com — still net positive over 12 months
52-Week Range
$345.32 – $1,373.40 / $1,376.26 ATH
Wide range reflecting 2025's volatility
Circulating Supply
130 – 134.78 Million BNB
Of original 200 million — Auto-Burn ongoing toward 100M target
24h Network Fees
$1,192,283
CoinGecko — direct chain revenue
24h Project Revenue
$119,478
CoinGecko
BNB Chain vs. Hyperliquid
BNB Chain now leads in daily revenue
Elfa AI, reported today, June 24
Binance Pair Removals
ME/USDC, NOT/FDUSD + others
Effective June 26, 2026 — routine delisting
BNBAgent SDK
Live on mainnet since May 19, 2026
AI-agent infrastructure for payments and identity
What's Actually Driving the Chart Right Now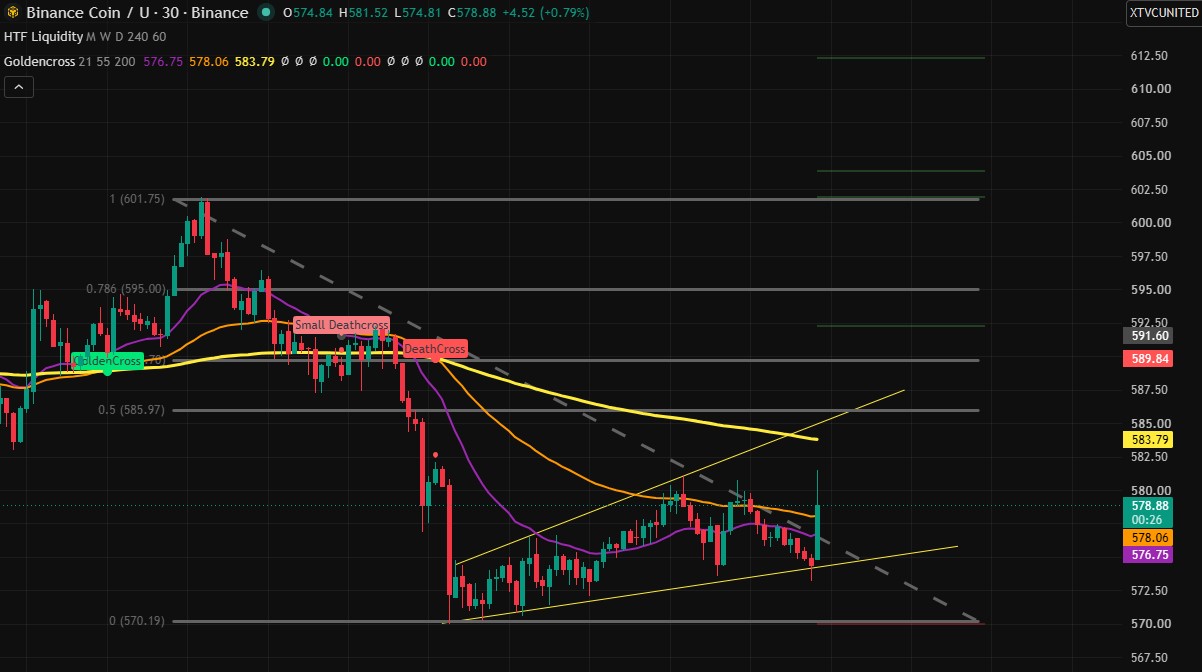
Short-Term:BNB is holding above the ascending trendline near $575. If buyers maintain momentum, the price could retest $580–$586 in the coming sessions.
Long-Term: As long as BNB remains above the major $570 support zone, the broader outlook stays cautiously bullish with potential targets around $595–$602.
Support Levels
Resistance Levels
The Trendline Test at $578-590
Multiple chart analysts on TradingView continue to flag the same structural story that's been building for weeks: BNB is sitting on a long-term ascending trendline in the $578-590 zone, a level that's been holding since roughly February 2026 and has reversed price upward from there multiple times.
As long as the price holds above $580, the bullish scenario stays technically valid, with targets toward $650 if the bounce confirms. A break below $560 would expose the next support around $464, based on the broader wave structure.
BNB Chain's Revenue Leadership
The Hyperliquid comparison matters because it's a direct, apples-to-apples usage metric rather than a speculative narrative. Chains earn revenue from transaction fees, and a sustained lead in that category typically signals that more actual trading and DeFi activity is happening on-chain — the kind of organic demand that, over time, feeds into BNB's burn mechanics through transaction fee consumption.
Ondo's Tokenized Stock Expansion Continues
Ondo Tokenized Stocks have enabled access to 438 U.S. stocks and ETFs on both Ethereum and BNB Chain via LI.FI, according to reporting from earlier today.
This continues a pattern that's been building since mid-June, where BNB Chain keeps accumulating real-world asset trading infrastructure from multiple directions—not just Binance's own bStocks initiative, but third-party platforms choosing to deploy on BNB Chain alongside Ethereum.
X Sentiment and Official Updates — June 24, 2026
Technical Picture — June 24, 2026
• Daily Chart: Bullish structurally—sitting on the ascending trendline at $578-590, described by multiple analysts as the critical decision zone for the next major move.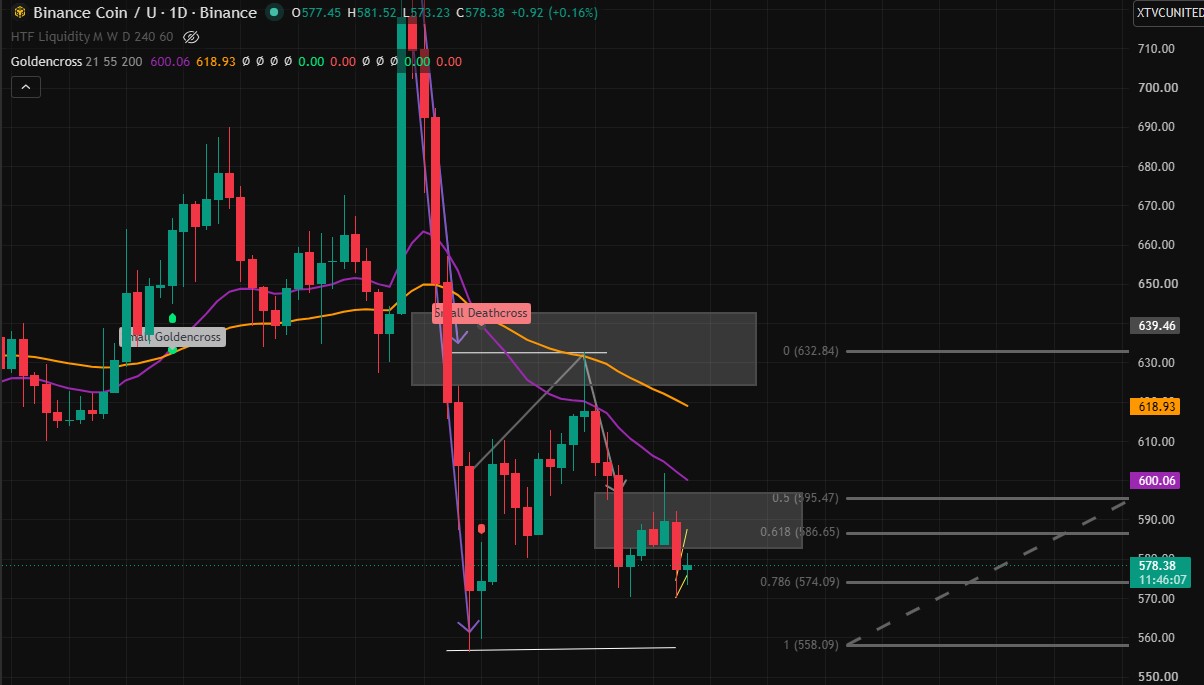
• 50-Day MA (Daily): Above price and rising, which could act as resistance on the way up. A confirmed close above this average would be a meaningful signal.
• 200-Day MA (Daily): Falling since May 20, 2026—reflecting genuine longer-term weakness underneath the shorter-term trendline structure.
• 200-Day MA (Weekly): Rising since November 30, 2025—providing longer-duration trend support that contradicts the daily-chart weakness, a genuinely mixed signal worth tracking.
• Key Support: $578, with a deeper structural floor around $464 if that level fails to hold.
• Key Resistance: $650, the level multiple analysts have cited as the next target if the trendline reversal confirms.
Price Predictions — All Timeframes
Sources: Changelly's modeled forecasts, TradingView technical analysis, CoinMarketCap data, current as of June 24, 2026.
Short-Term (June – July 2026)
Scenario
Price Range
Probability
Key Driver
Bull Case
$647 – $685
30%
$560-580 trendline holds and reverses upward; BNB Chain revenue leadership continues
Base Case
$586 – $647
45%
Changelly's stated June floor of $586.56 holds; market stays range-bound near current levels
Bear Case
$500 – $560
25%
Trendline breaks; broader market risk-off; revenue gains don't translate to demand
Year-End 2026 (Changelly Model)
Month
Forecast Range
Average
July 2026
$647.95 – $684.77
$666.36
August 2026
$632.56 – $673.32
$652.94
September 2026
$641.53 – $665.23
$653.38
Long-Term (2030 and Beyond — Coinpedia)
Year
Price Range
Condition
2026 (Bull)
Toward $1,000
If $600 support holds and ecosystem demand grows
2030
$2,500 – $4,500
If blockchain adoption grows and ecosystem activity remains strong
2040 (Long-Term)
$13,000 – $38,000
If network expands globally with strong DeFi/Web3 adoption
Key Risks
• Daily Chart 200-Day MA Weakness: Falling since May 20, 2026—until this flattens and turns upward, longer-term technical conviction stays limited even with the trendline holding short-term.
• Revenue-to-Price Disconnect: The Hyperliquid revenue flip is a genuinely positive usage signal, but it hasn't yet shown up in price. If that gap persists for weeks without resolution, it raises questions about whether on-chain revenue actually translates to token demand at the pace markets expect.
• Routine Exchange Pair Removals: While the June 26 delisting of ME/USDC, NOT/FDUSD, and others isn't BNB-specific, any holder of the directly affected pairs needs to act before that date.
• Macro Correlation: BNB's monthly decline has tracked broader crypto market softness more than any BNB-specific negative catalyst — a continuation of market-wide caution would likely weigh on BNB regardless of its own fundamentals.
The Bottom Line on BNB Right Now
Today's real story for BNB isn't the price—it's the Hyperliquid revenue flip that confirms BNB Chain is currently generating more on-chain fee revenue than one of crypto's most closely watched high-growth chains
That's a fundamental signal worth more weight than a single day's percentage move, even if the market hasn't priced it in yet.
For anyone tracking BNB today, the trendline at $578-590 remains the technical level that matters most; the June 26 pair removals are a housekeeping item to check if you're affected; and the gap between rising on-chain revenue and a still-soft monthly price chart is the more interesting tension to watch resolve over the coming weeks.
Disclaimer: This report is for informational and educational purposes only. It does not constitute financial, investment, or legal advice. All price predictions are speculative. Cryptocurrency markets carry extreme risk, including total loss of capital. Always conduct your own independent research (DYOR) before making any financial decisions.