BNB price prediction interest is building as Binance Coin works through a trendline retest that buyers have so far managed to defend. The coin broke above a long-standing ascending trendline,
BNB price prediction interest is building as Binance Coin works through a trendline retest that buyers have so far managed to defend.
The coin broke above a long-standing ascending trendline, dipped back down to test it, and held its ground rather than printing a fresh low.
Technical analysis prepared by CoinGabbar's crypto research desk. This piece is for informational purposes only and is not financial advice. CoinGabbar and the analyst do not hold a position in BNB at the time of publication.
The levels described here apply strictly to the 1-hour timeframe covered and should be rechecked if the price closes beyond the stated range.
BNB Trend and Momentum: Key Takeaways
Binance coin broke below its ascending trendline, retested it, and failed to print a new low
Price has since pushed back to the upside, currently trading near $595.75
A confirmed close above $606.06 opens the door toward $615.74 and then $632.77.
A close below $592.17 instead shifts focus to $588.11 and then $581.62
The built-in momentum oscillator is reading 47.52, still below the midline
Liquidations have leaned heavily toward longs across every recent window
BNB Price Right Now
Metric
Value
Price
$595.75
1H Open / High / Low / Close
$589.44 / $592.75 / $589.37 / $592.57
24H Change
+0.53% ($3.12)
Market Cap
$79.24B
Futures Volume (24H)
$582.23M
Spot Volume (24H)
$95.66M
Open Interest
$955.37M
Circulating Supply
133.16M BNB
Total Supply
133.16M
Max Supply
133.16M
Open interest is the total value of derivative contracts still open across exchanges, a rough gauge of active leveraged positioning.
Chart source: BNB/USDT perpetual contract, 1 hour timeframe, TradingView, Binance data feed, captured August 6, 2026, around 01:13 PM IST (07:43 UTC). Market cap, volume, and supply data from BNB market data on CoinGlass were captured the same day.
Methodology and Data Sources
This read uses the 1 hour chart for trendline structure, with price, volume, open interest, and market cap figures from CoinGlass, liquidation flow from CoinGlass's liquidation tracker, and fresh ecosystem news for added context.
Levels are only treated as invalidated on a confirmed closing candle beyond the stated trigger, not an intraday wick.
$BNB Enters the S&P Pantera Digital Asset Index
Beyond the chart, there is a fresh piece of context worth flagging for this BNB price prediction.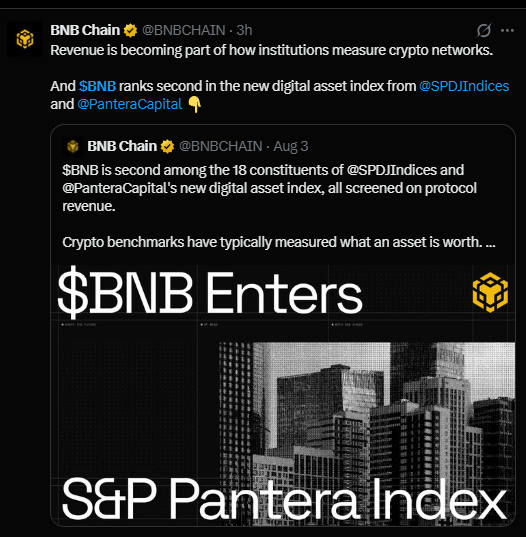
BNB Chain confirmed that BNB now ranks second among eighteen constituents in a new digital asset index built by S&P Dow Jones Indices and Pantera Capital, an index that screens assets on protocol revenue rather than market value alone.
That shifts part of the narrative around BNB toward its actual ecosystem earnings rather than pure price speculation.
Source: BNB Chain on X, August 6, 2026.
Binance coin Liquidation data
Liquidation data from CoinGlass shows longs have taken the heavier hit across every window measured. 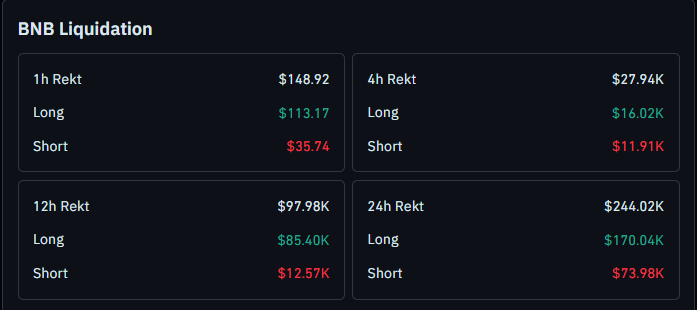
The 1-hour window saw $148.92 total, with $113.17 of that from longs against $35.74 from shorts.
The 4-hour window shows $27.94K total, with $16.02K from longs against $11.91K from shorts.
That long heavy lean holds over 12 hours, with $97.98K in total liquidations and $85.40K coming from longs, and again over 24 hours, where $244.02K in total liquidations includes $170.04K from longs against $73.98K from shorts.
Source: BNB liquidation data, CoinGlass, checked August 6, 2026, around 01:13 PM IST.
Has BNB's Trendline Reclaim Actually Held?
Has BNB's break below its trendline actually stuck, or is this just a pause before a deeper pullback? The retest so far says the reclaim is holding, since the price came back down to the line and failed to print a lower low before turning back up.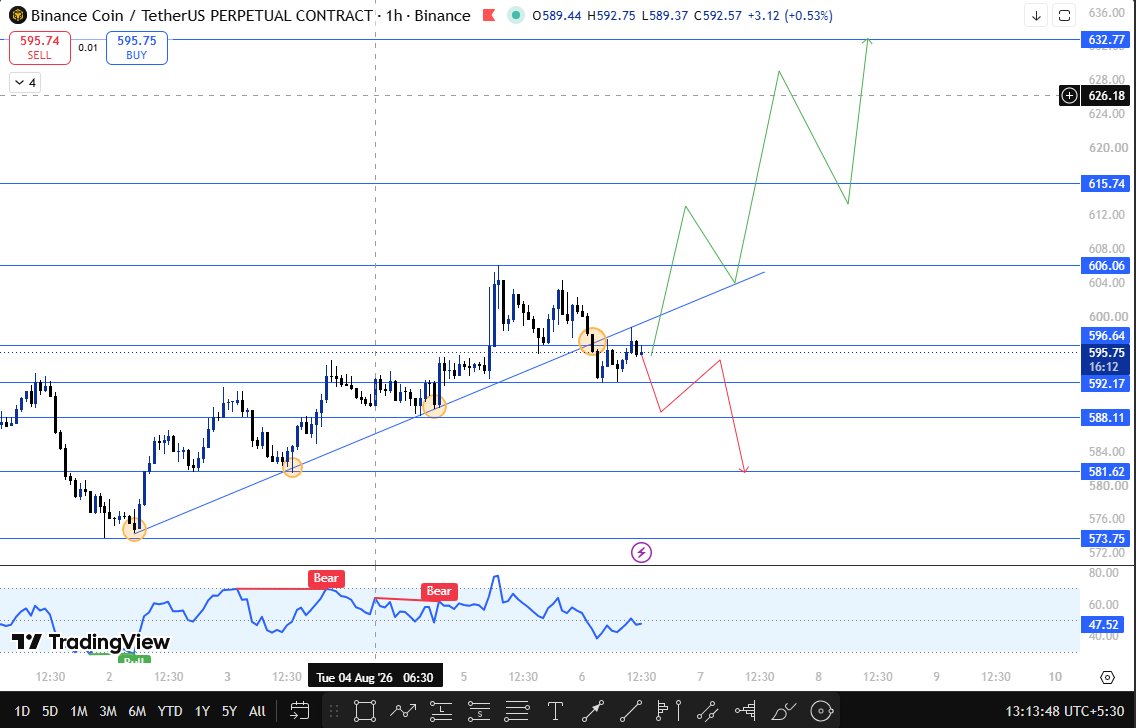
Binance coin spent recent sessions climbing along a rising trendline built from a series of higher lows.
The coin eventually broke above that line, which on its own does not confirm much until the market comes back to test the breakout.
That retest happened next, with the price dipping back toward the trendline before buyers stepped in and refused to let it carve out a new low.
That failed retest is generally read as a sign of underlying strength, since sellers had a clear opportunity to push price lower and could not do it.
Price has since turned back to the upside, and the next real test is whether BNB can close an hourly candle above $606.06, which would open the path toward $615.74 and eventually $632.77 if the move extends.
The bearish alternative is still on the table. A close back below $592.17 would suggest the trendline reclaim is weakening, with $588.11 as the first support level and $581.62 as the deeper target if selling pressure builds.
The momentum oscillator RSI reading of 47.52, still sitting below the midline, means momentum has not fully confirmed the bounce yet, which is why the follow-through above $606.06 matters so much here.
Technical Outlook Snapshot
Indicator
Signal
Trendline Structure
Broken and retested, no new low printed
Momentum Oscillator RSI
47.52, below neutral midline
Immediate Bias
Cautiously bullish above $592.17, confirmation needed above $606.06
Liquidation Skew
Long and heavy across all measured windows
Support and Resistance Levels to Watch
Type
Level
Note
% From CMP
Extended pivot
$632.77
Distant bullish target on continuation
+6.21%
Extended pivot
$626.18
Secondary level above main resistance
+5.11%
Resistance 1
$615.74
Next resistance after breakout confirmation
+3.36%
Breakout Trigger
$606.06
Confirms renewed strength on a closing basis
+1.73%
Current Price
$595.75
Trading above the reclaimed trendline
—
Breakdown Trigger
$592.17
Invalidates the reclaim on a closing basis
-0.60%
Support 1
$588.11
Next support if $592.17 fails
-1.28%
Extended pivot
$581.62
Deeper target if selling pressure builds
-2.37%
Risk-Reward Table
Case
Trigger
Target
Bull Case
Closes above $606.06
Move toward $615.74, with $632.77 in play on continuation.
Bear Case
Closes below $592.17
Slide toward $588.11, with $581.62 as the deeper target.
What Would Change This BNB Price Prediction?
The setup stays undecided while the price holds between $592.17 and $606.06.
A confirmed close above $606.06 would validate the trendline reclaim and put $615.74 back in focus, while a close below $592.17 would suggest the reclaim has failed and shift attention to $588.11.
How Bitcoin Sentiment Could Move BNB
This setup is built off BNB's own chart, but Bitcoin still tends to set the tone for how far a move like this can extend.
A steadier Bitcoin tape improves the odds of clearing $606.06 and testing $615.74, while a weaker Bitcoin backdrop raises the risk that BNB loses $592.17 and slides toward $588.11.
When This BNB Price Prediction Gets Revisited
This Binance coin price prediction will be revisited on a confirmed close above $606.06 or below $592.17, or if no clear direction is confirmed within 24 hours of publication.
Glossary
Trendline: A line connecting a series of higher lows or lower highs used to track directional support or resistance
Trendline Retest: When price returns to a broken trendline to test it as new support or resistance before continuing in the breakout direction
Open Interest: The total value of derivative contracts still open and unsettled
Liquidation: The forced closing of a leveraged position when a trader runs out of margin
Momentum Oscillator: A chart indicator that measures the speed and strength of recent price moves
Bull, Base, and Bear Case
Bull Case: BNB holds the reclaimed trendline as support, closes above $606.06, and works through $615.74 on its way toward the $632.77 zone, aided by the ongoing narrative shift toward revenue backed valuation following the S&P Pantera Index listing.
Base Case: BNB consolidates between $592.17 and $606.06 while momentum catches up to price, keeping the setup a wait and watch situation until one of the two levels breaks with conviction.
Bear Case: BNB loses the reclaimed trendline, closes below $592.17, and slides toward $588.11 and then $581.62, a move that would likely coincide with a fresh wave of long liquidations given how skewed current positioning already is.
Disclaimer
This Binance coin price prediction is based on technical chart analysis and market data available at the time of writing.
Cryptocurrency markets are highly volatile, and prices can change rapidly. This content is for informational purposes only and should not be considered financial advice.
CoinGabbar and the analyst do not hold a position. Always do your own research and consult a qualified financial advisor before making any investment decisions.