BUILDon just came right back down to the exact zone that kicked off its last big move, and it's already showing signs of life there. This BUILDon price prediction covers what the daily and 4-
BUILDon just came right back down to the exact zone that kicked off its last big move, and it's already showing signs of life there.
This BUILDon price prediction covers what the daily and 4-hour charts, liquidation data, and holder distribution show right now.
Where BUILDon Sits Right Now
BUILDon is currently trading around $0.172.
The 4-hour candle tells the story: it opened at $0.11334, ran as high as $0.17528, and closed at $0.17248, up 52.18% in one window. That's a real, decisive move.
If the price moves meaningfully past the levels below, treat these as due for a refresh.
Liquidations: Shorts Got Caught Off Guard
As per Coinglass liquidation data dashboard, this breakout caught shorts leaning the wrong way.
Last hour: $73.20K liquidated, $68.05K from shorts. 4h: $125.43K total, $114.84K from shorts.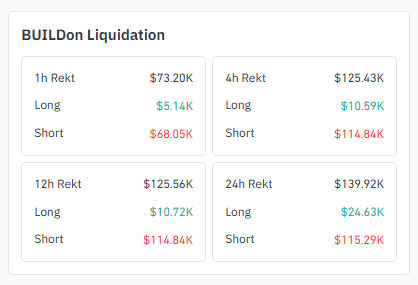 Source:Liquidation Data Taken From Coinglass
12h and 24h windows match $125.56K and $139.92K, both dominated by shorts. Squeezes like this often add fuel short-term, though they don't guarantee the rally holds once forced buying fades.
Exchange Volume: Binance Carries the Bulk
Per the exchange volume heatmap, Binance dominates at $39.72M, well ahead of everyone else. 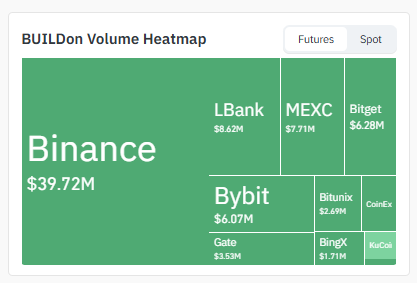
Source: Volume Heatmap Data Taken From Coinglass
LBank ($8.62M), MEXC ($7.71M), and Bitget ($6.28M) form the next tier, with Bybit ($6.07M), Gate ($3.53M), Bitunix ($2.69M), and BingX ($1.71M) making up the rest.
With Binance so dominant, price action there is the clearest signal of staying power.
Holder Distribution: Whale-Heavy, But Not Top-Heavy
As per the data from the bscscan on-chain holder analytics dashboard, whale-tier wallets control 79.35% of the supply. 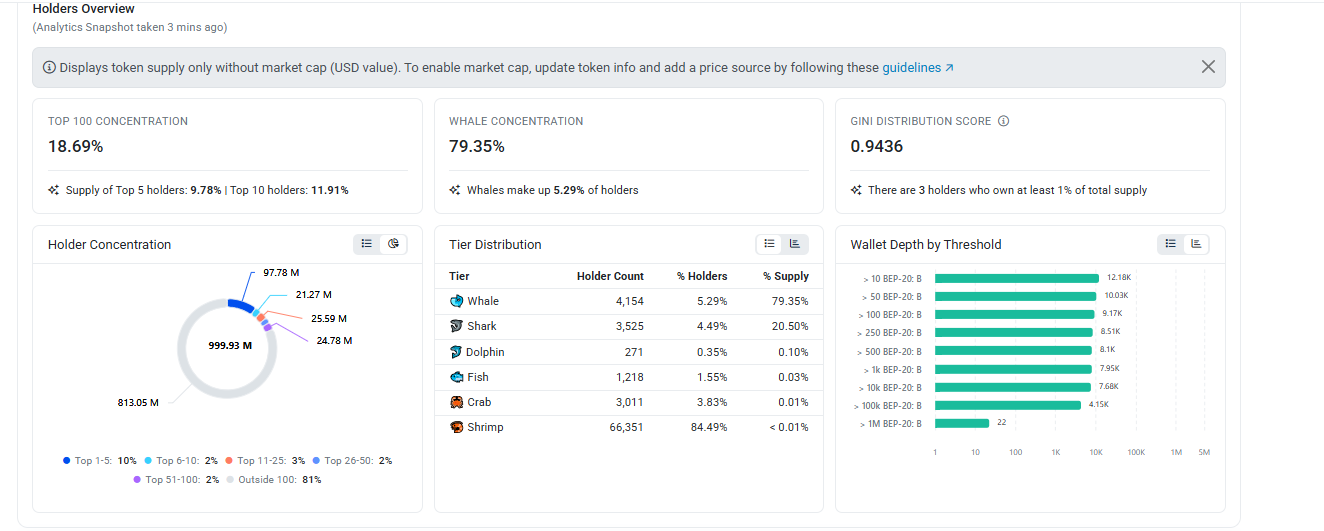
Source:Data Taken From bscscan
But unlike tokens, where a handful of top 100 wallets hold nearly everything, BUILDon's top 100 account for just 18.69% of the whale supply, which is spread across 4,154 wallets, not a tiny handful.
The Gini score of 0.9436 still points to real concentration, but this broader base means less risk of one or two wallets single-handedly reversing today's move.
4-Hour Chart: A Genuinely Strong Breakout Candle
BUILDon just printed a massive green candle up 52.18%, a real body, close near the high, not a wick that faded. It broke through its prior base and pushed the price to $0.17248.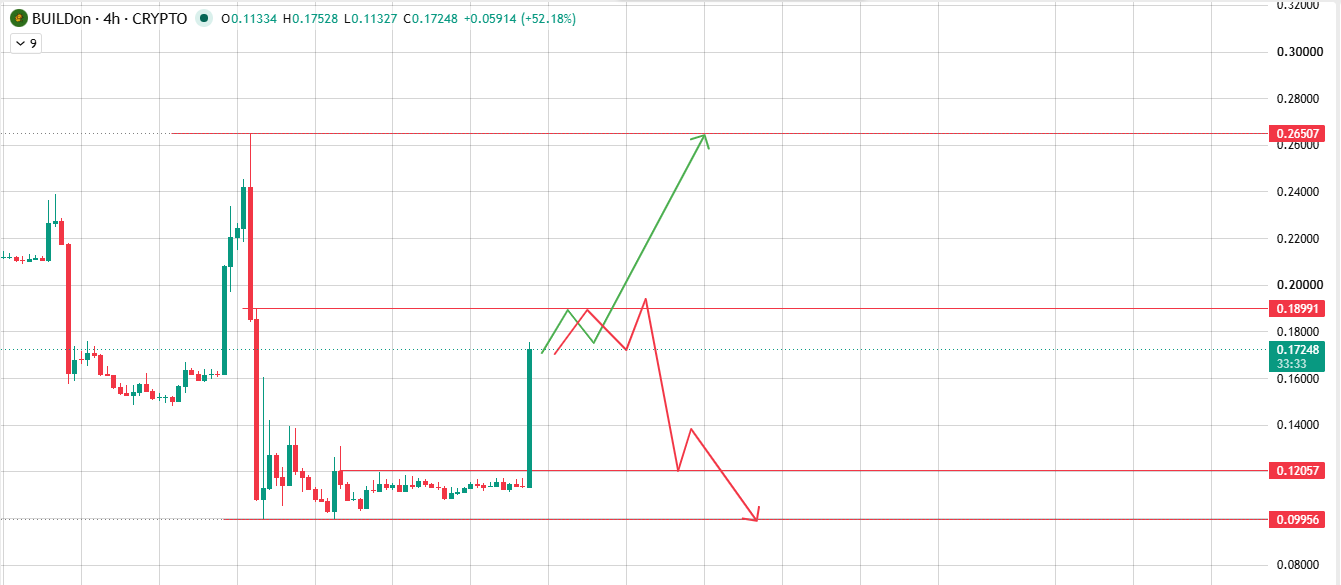
Source:Chart Taken From TradingView
Immediate resistance sits just overhead at $0.18991, close enough to get tested soon if momentum holds.
Given the candle's strength, a push toward $0.26507 looks genuinely possible. If the move fades, $0.12057 is first support, then $0.09956.
4H LevelPriceImportanceResistance 2
$0.26507Extended target if momentum continuesResistance 1
$0.18991Immediate resistance just above priceSupport 1
$0.12057First support if the breakout fadesSupport 2
$0.09956Deeper support
Daily Chart: Back at a Proven Support Zone
The current trading price at $0.17204 sits right on a support zone that's mattered before.
This is what the price bounced off during BUilDON last major run, a move that carried it toward the $0.77 price rolling over. After a sharp drop, the price is back at that level and holding.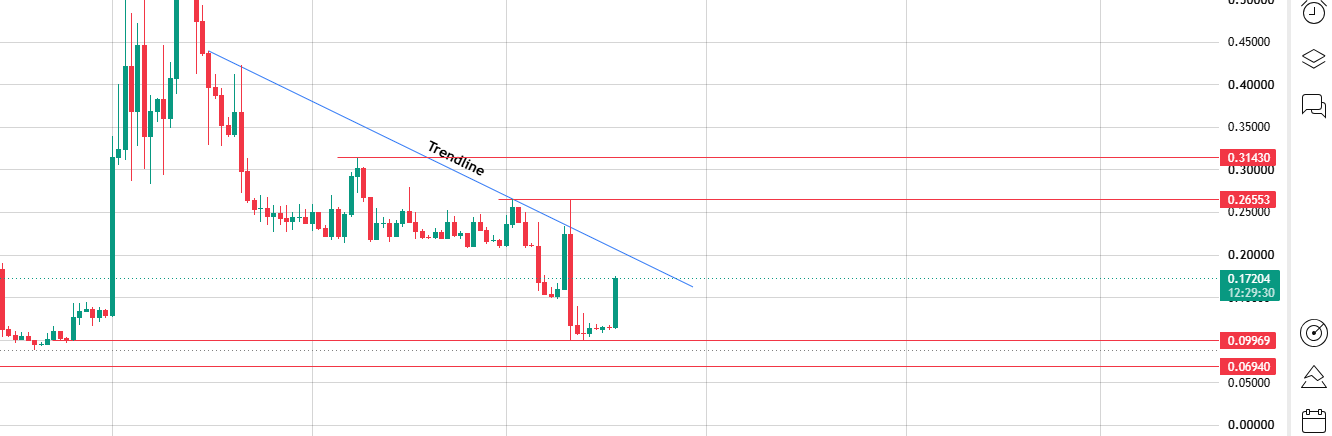
Source:Chart Taken From TradingView
The falling trendline sits just above, capping every recovery since the top. Break it; first target $0.26553, then $0.31430 on real momentum.
Support fails instead, the next level is $0.09969, then $0.06940.
1D LevelPriceImportanceResistance 2
$0.31430Extended bullish targetResistance 1
$0.26553Target if the trendline breaksSupport 1
$0.09969First level if support failsSupport 2
$0.06940Deeper breakdown target
Price Scenarios
Daily chart price target scenarios
ScenarioTriggerTargetsBullish BreakoutTrendline breaks, confirmed close
$0.26553 → $0.31430NeutralSupport holds, no breakContinued consolidationBearish BreakdownThe support zone fails
$0.09969 → $0.069404-hour chart price scenario
ScenarioTriggerTargetsBullish Breakout4H close above
$0.18991$0.18991 → $0.26507NeutralHolds
$0.12057–$0.18991Digesting the breakoutBearish Breakdown4H close below
$0.12057$0.12057 → $0.09956Bear Case
A wick beyond resistance or support doesn't confirm anything alone; this needs a full daily or 4H close beyond those levels.
Beyond the usual BTC-ETH dominance/ETH correlation risk: much of today's move came from forced short liquidations rather than organic buying, so momentum could cool once that pressure clears.
Large candles also sometimes get partially retraced; that alone wouldn't invalidate this setup unless the price closes back below the 4H supports above.
Glossary
Trendline: a line connecting price highs or lows to visualize trend direction.
Support zone: an area where buying pressure has previously halted a decline.
Short squeeze: a sharp price rise forcing short sellers to buy back, often accelerating the move.
Liquidation: the forced closing of a leveraged position when losses exceed margin.
Methodology
Levels are read directly from the 1D and 4H charts on TradingView, dated July 18, 2026. The $0.77 reference reflects prior price action at this same support zone.
Liquidation, volume, and holder-distribution figures come from their respective dashboards, also dated July 18, 2026.
Nothing here is extrapolated; reconfirm levels against live charts before publishing.
Final Outlook
BUILDon's setup is more interesting than most right now: a strong breakout candle at a support zone that's already proven itself once.
Short-liquidation data shows real force behind this move, and Binance's dominant volume share means real follow-through should show up there first.
Break the daily trendline with conviction, and $0.26553 comes into range; lose this support instead, and $0.09969 becomes the level to watch.
Cryptocurrency markets are highly volatile, and this article is for informational purposes only; it should not be considered financial advice. Always do your own research before making investment decisions.
Disclaimer: This article is for informational and educational purposes only and does not constitute financial advice. Cryptocurrency markets are highly volatile. Do your own research and consult a licensed financial advisor before making any trading or investment decision.