CAP is trading around $0.01603 right now, down 20% today and sitting right at a level that could decide its next move. This Cap Price Prediction breaks down why the token has been under press
CAP is trading around $0.01603 right now, down 20% today and sitting right at a level that could decide its next move.
This Cap Price Prediction breaks down why the token has been under pressure, what the liquidation data is showing, and what both the short-term and long-term charts say about where it goes from here.
$Cap is an onchain credit marketplace built on Ethereum that lets users earn institutional-grade yield on stablecoins, with every loan backed by escrowed, overcollateralized guarantees enforced through smart contracts.
With the price now testing key support after a sustained slide, the real question is whether buyers step in here or the descending channel stays firmly in control.
Cap Price Prediction: Market Overview
Metric
Value
Current Price
$0.01603
24h Change
-20%
24h Range
$0.01591 – $0.0197
Market Cap
$25.028M
Fully Diluted Valuation
$160.437M
24h Trading Volume
$5.861M
Circulating Supply
1.56B $CAP
Total / Max Supply
10B $CAP
Source:Data from CoinGecko
Cap Price Prediction: $CAP Liquidation and Volume Data
Leverage has been getting cleared out steadily as $CAP has fallen.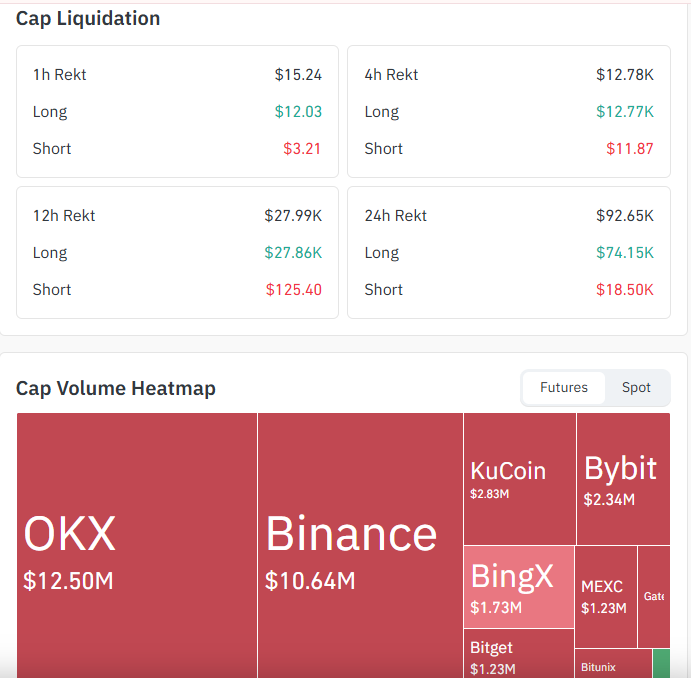
Source:Data From CoinGlass
Over the last 24 hours, $CAP saw $92.65K in total liquidations, with $74.15K coming from long positions against just $18.50K in shorts, showing leveraged buyers have been taking the brunt of this decline.
In the 12-hour window, the pattern flips slightly, with $27.86K in long liquidations against just $125.40 in shorts, reinforcing that longs have been the ones under pressure through most of this move.
Futures trading volume remains active despite the drop, led by OKX at $12.50M and Binance at $10.64M, with meaningful volume also flowing through KuCoin, Bybit, BingX, MEXC, and Bitget.
That level of continued activity suggests traders are still actively positioning around $CAP rather than abandoning it entirely.
Cap Price Prediction: Short-Term Chart Analysis
On the 4-hour chart, 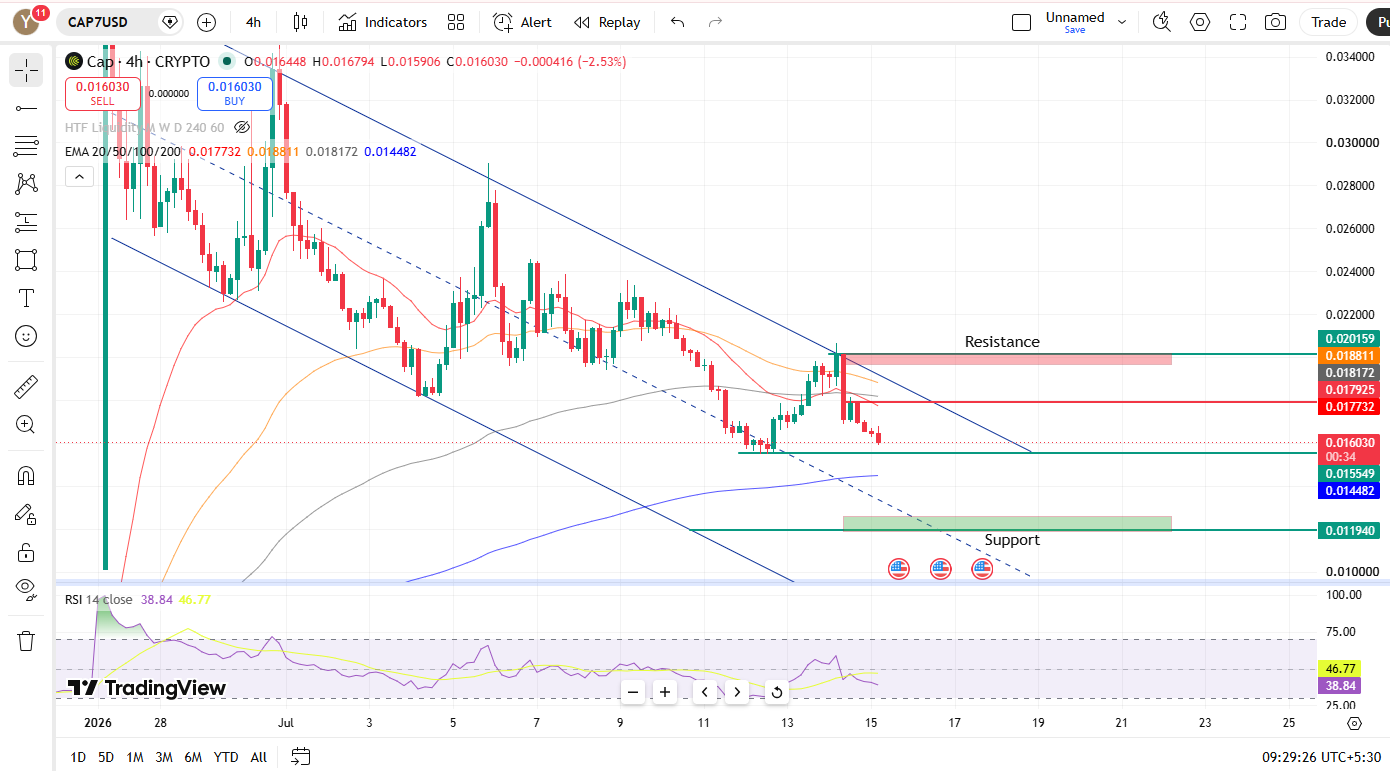
$CAP has been trading inside the descending channel pattern since June ended, and price recently pushed slightly above the channel's upper boundary before pulling back toward support.
The price did not sustain itself and started falling back from the upper levels. The price is at a very important level of $0.016030.
Price is trading below the EMA 20 ($0.017732), EMA 50 ($0.018811), and EMA 100 ($0.018172) but above the EMA 200 ($0.014482), a mixed setup that keeps the short-term trend cautious rather than clearly bearish.
RSI on this timeframe sits at 38.84,and the moving average of RSI is at 46.77, pointing to soft but not extreme selling pressure.
Cap Price Prediction: Short-Term Key Levels of $CAP
Support Levels
Resistance Levels
$0.015549
$0.017732
$0.011940
$0.020159
Cap Price Prediction: Long-Term Chart Analysis
On the daily chart price sits on an important zone,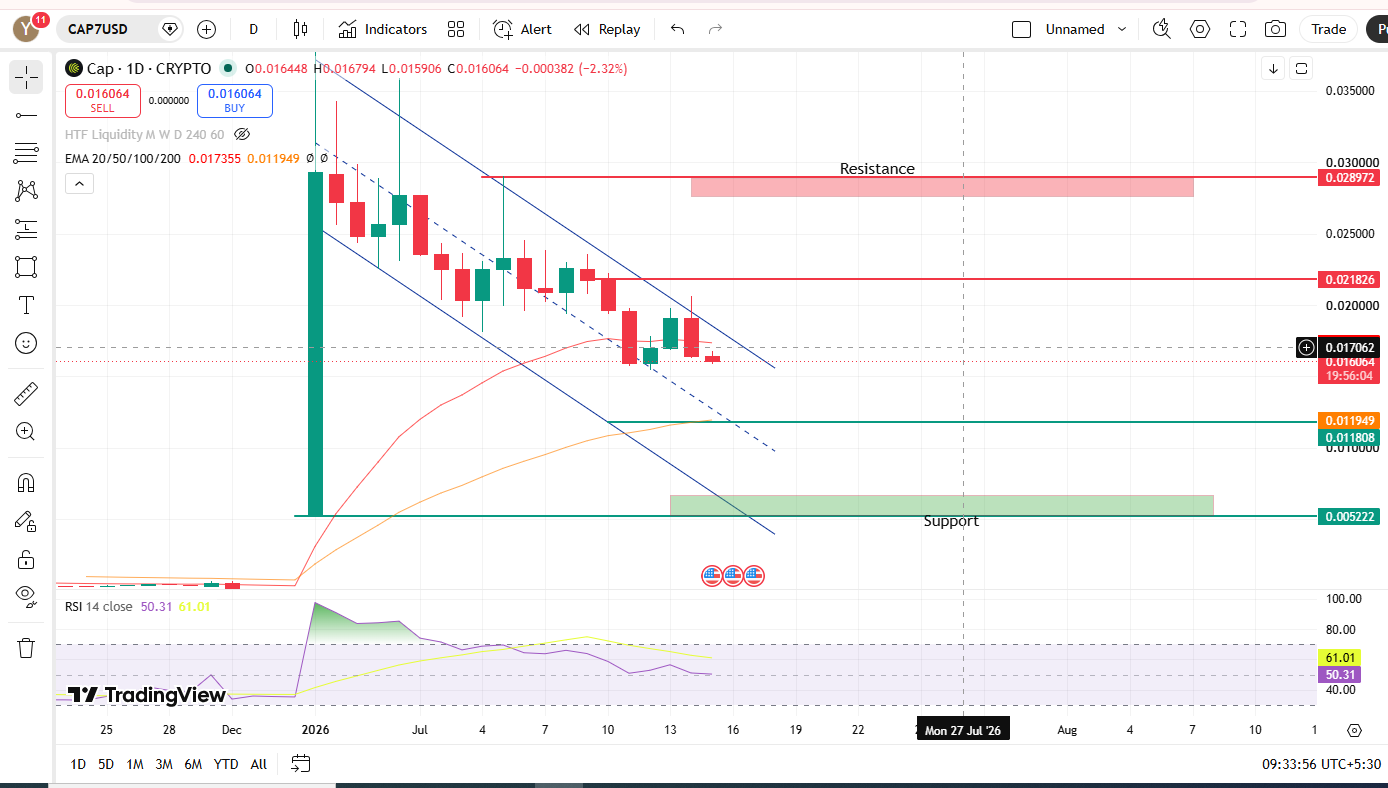
since it represents the first real test of whether buyers can hold the line after a sustained slide.
EMA data is limited on the daily timeframe for this newly listed token, with only the EMA 20 ($0.017355) and EMA 50 ($0.011949) currently available. The daily RSI sits at 50.31 and the moving average of RSI at 61.
The view is if $CAP break the channel pattern, the above important levels act very strongly so keep an eye on that
Cap Price Prediction: Long-Term Key Levels of $CAP
Support Levels
Resistance Levels
$0.011808
$0.021826
$0.005222
$0.028972
Cap Price Prediction: Expert View
As per the market analyst, $CAP is sitting at a real inflection point after weeks inside a descending channel on both timeframes.
The heavier long liquidations over the past 24 hours show leveraged buyers have already been flushed out.
Which can sometimes clear the way for a more stable base to form. $0.017732 on the short-term chart and $0.021826 on the daily chart are the levels that matter most on the upside.
Losing $0.015549 would open the door toward the deeper $0.011940 and $0.011808 support zone.
Disclaimer: This content is for informational purposes only and is not financial advice. Crypto markets are highly volatile; always do your own research before making any investment decisions.