The CAP token price has been bearish for more than one week, and the charts do not seem to favor it. The 1-hour and 4-hour time frames and CAP Price Prediction tell a similar story of $CAP be
The CAP token price has been bearish for more than one week, and the charts do not seem to favor it.
The 1-hour and 4-hour time frames and CAP Price Prediction tell a similar story of $CAP being in an intact descending trend channel since June, which means that its price keeps making lower highs.
At the moment, CAP trades around $0.0188 and hovers near a demand area that buyers could depend on before. This is something to watch and see how things turn out.
It is clear that sellers have been having the best of it lately, and this article will explain everything about the price of the $CAP token and CAP Price Prediction
Market Data Overview and CAP Price Prediction.
Metric
Value
Current Price
~$0.0188
24-Hour Range
$0.01814 – $0.02243
7-Day Change
35.4% to 36.4%
Market Cap
$29.3M
Fully Diluted Valuation (FDV)
$187.7M
24-Hour Trading Volume
$42M–$47M
Circulating Supply
1.56B – 1.6B CAP
Total / Max Supply
10B CAP
All-Time High
$0.04257 (-56% from ATH)
All-Time Low
$0.0182 (+2.7% above ATL)
As per the most recent snapshot, CAP ($CAP) is currently priced at about $0.01884, having dropped by about 36% from its price of one week ago.
This is because at present, $CAP is trading just a few points above its historical lowest level, which is itself a significant indicator that it is testing a historical level and not a mere retracement within an upward trend.
The token has strong trading activity, especially on the Bybit exchange, where it trades against USDT, and also on the Coinbase Exchange and LBank.
Source: Data from Coingecko
Liquidations: For all time frames (1 hour to 24 hours), liquidations consist mostly of long positions, where $152.57K was liquidated in the past 24 hours compared to only $1.91K in shorts.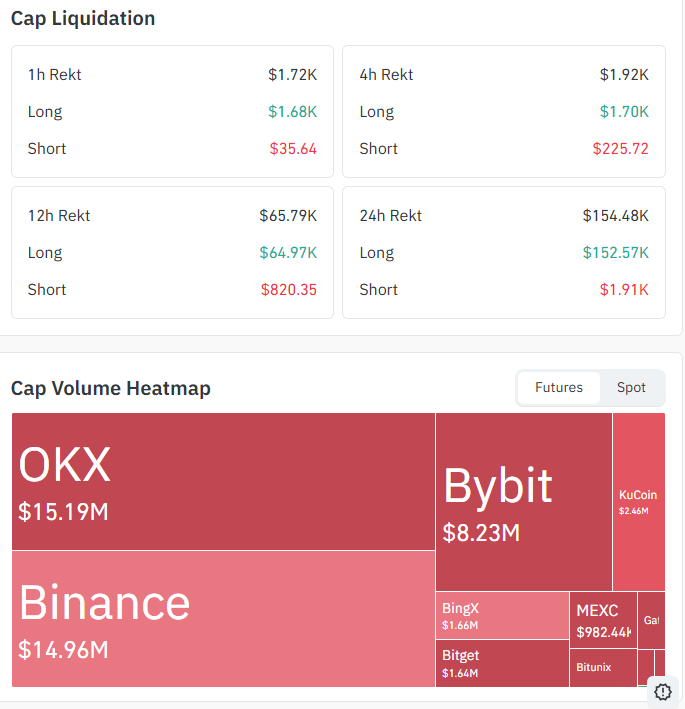
The above fact indicates that the traders who were anticipating a rebound have been liquidated as the price continued to fall.
Volume Heatmap: Futures trading is mainly done through OKX ($15.19M) and Binance ($14.96M).
Bybit has the third-largest futures market with $8.23M worth of futures contracts.
Conclusion: Long liquidations and decent volume in major exchanges indicate that there has been heavy leverage sell-off in this move.
Source: Data from CoinGlass
Chart Analysis of CAP coin in 1-Hour and 4-Hour Timeframes
1-Hour Chart and CAP Price Prediction.
On the 1-hour timeframe, $CAP is trading in a downtrend channel since the end of June, forming lower highs and lower lows consistently.
Recently, price has broken out from a short-term consolidation pattern and has fallen straight into the support zone at $0.0185–$0.0187.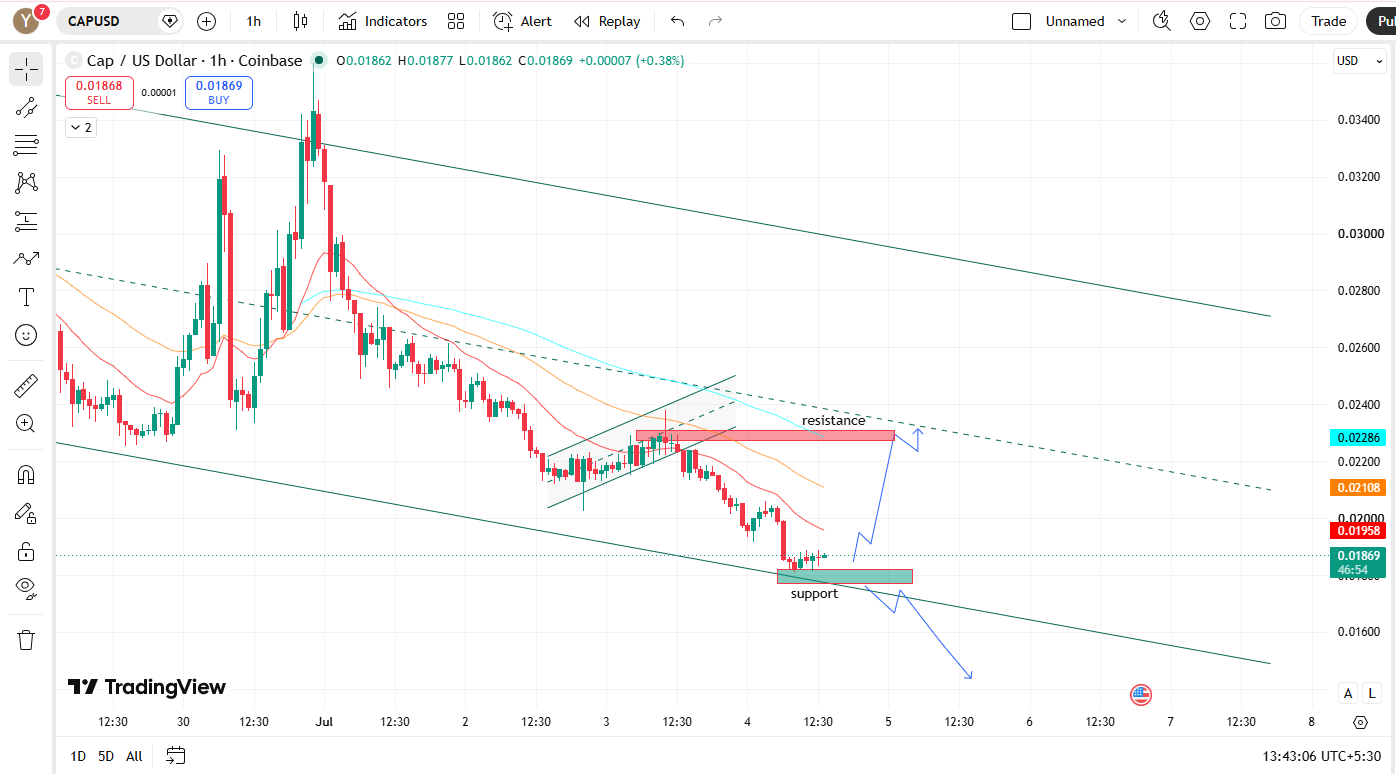
This level is a short-term one and may provide temporary resistance; however, unlike the levels on the higher timeframe, it is likely to be retested.
The view is if it respect the current support, the price may go to the 0.02040 level and after that it can go to 0.02200
4-Hour Chart and CAP Price Prediction.
There is the same downtrend channel that has been intact since the end of June, and the price is now testing the lower border of this larger channel, not just the minor level inside it.
The 4-hour support level at $0.0186–$0.0188 corresponds not only to the horizontal demand zone but also to the uptrend line within the channel.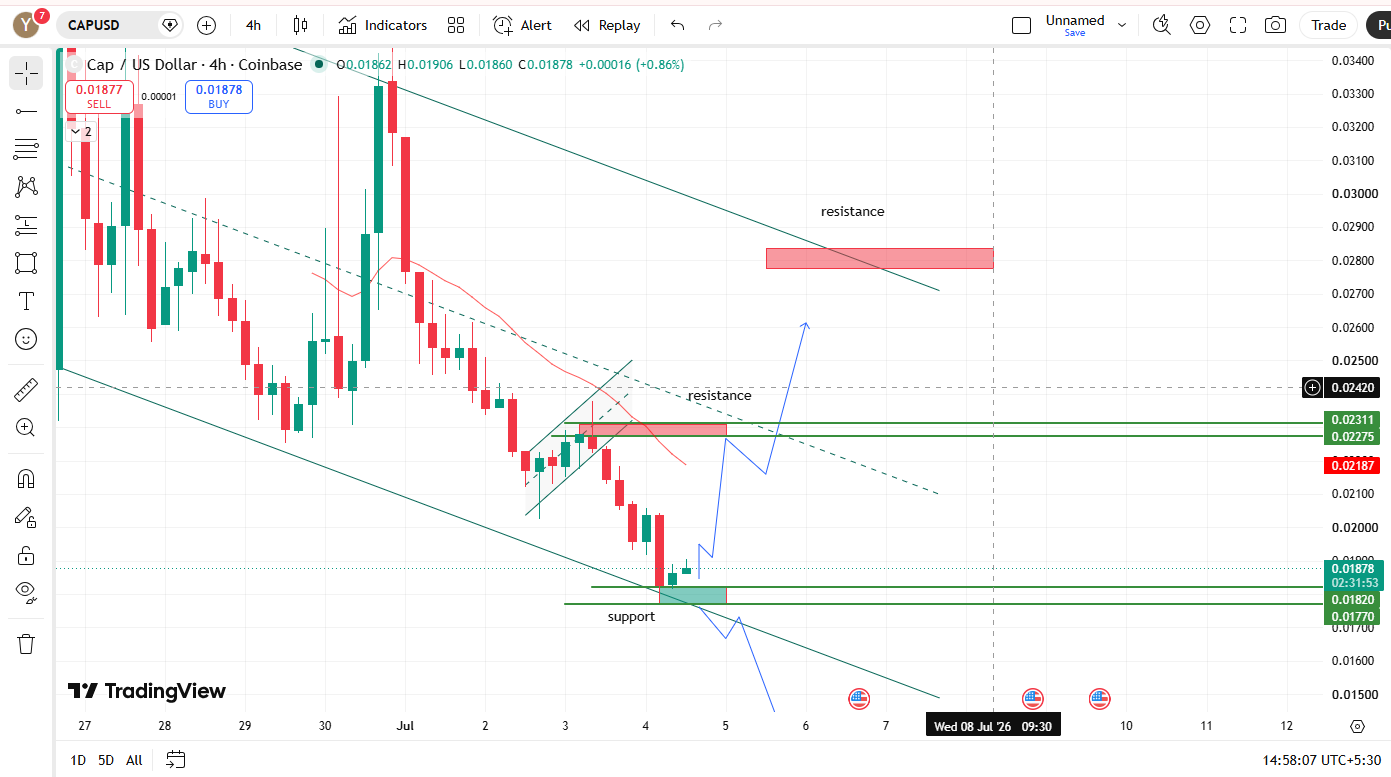
Key Support and Resistance Levels
Resistance:
Support:
$0.0185 – $0.0188 — current demand zone under test, reinforced by the descending channel's lower trendline on the 4-hour chart.
$0.0182 — the token's all-time low; a break below current support could bring this level into focus.
Macro channel base:
Expert Opinion and CAP Price Prediction.
The $CAP chart is not the only thing that looks unstable; the sentiment itself has turned bearish and is even underperforming compared to the market as a whole this week.
The record high had just been reached a couple of days ago, thus making the price fall even faster.
$CAP supports a yield-generating stablecoin protocol on the Ethereum network, thus being subject to the DeFi risk appetite trends as well.
Given the descending channel and low appetite, it appears more like a relief move rather than a bullish one.
Disclaimer
The following article is meant to provide information only and should not be construed as financial advice. Cryptocurrency markets are extremely volatile; it is always important to conduct your own research and consult with a professional financial advisor before making investments. The author and the publishing entity are not responsible for any losses incurred.