
Bitcoin3 min read
Bitcoin Düşüşünün Ardındaki Yeni Risk!
Bitcoin fiyatındaki son gerilemenin arkasında yalnızca kripto para piyasasına özgü gelişmeler bulunmuyor. Analiz şirketi QCP Capital, yapay zekâ altyapısına borçlanarak yatırım yapan şirketle
Key Highlights ADA trades at $0.2086 — down 3.36% — after breaking below a rising parallel channel that held since late June per @alicharts SuperTrend flipped bearish; last flip in May 2025 p
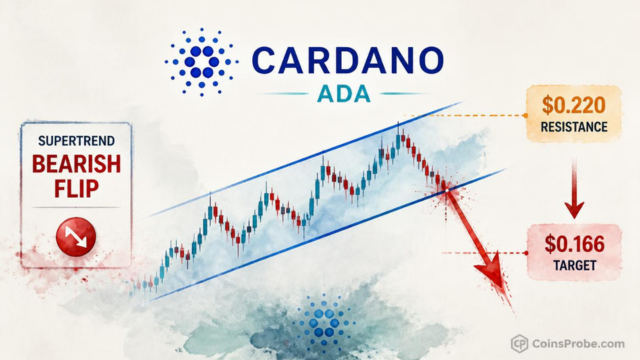
Key Highlights
ADA trades at $0.2086 — down 3.36% — after breaking below a rising parallel channel that held since late June per @alicharts
SuperTrend flipped bearish; last flip in May 2025 preceded a 46% correction on ADA
$0.220 is the critical resistance — a sustained hold below targets $0.166, roughly 20% lower
Whale holdings (100M–1B ADA bracket) were flat over prior 10 days — no confirmed selling conviction yet
Cardano is trading at $0.2086 — down 3.36% in the last 24 hours — and the chart structure that supported the token since late June has now officially cracked. This is not a routine pullback. Analyst Ali Martinez (@alicharts) has confirmed a breakdown from the rising parallel channel that carried ADA from $0.138 to $0.282 over four months, and the technicals now point toward a deeper leg lower.
“CARDANO BREAKDOWN CONFIRMED,” Martinez wrote on October 24, 2026, flagging that ADA has broken below the channel’s lower boundary — a level that, if it holds as resistance, sets up an approximately 20% decline from the $0.220 zone down to $0.166. This is the second bearish signal Martinez has flagged on Cardano within the same week, following a SuperTrend flip that he noted last flipped bearish in May 2025 — immediately preceding a 46% correction.
From late June through mid-October 2026, ADA built a clean rising parallel channel — a structure defined by two parallel trendlines bounding price action on both sides. The lower boundary of this channel served as dynamic support through multiple retests, absorbing selling pressure each time price approached it. The channel’s range was substantial: a $0.144 swing from the $0.138 floor to the $0.282 peak, representing a 104% move at its peak.

ADA Daily Chart | Source: @alicharts (X)
That structure is now broken. Martinez’s analysis, published with a video chart illustrating the channel break, confirms that ADA has closed below the lower boundary. The breakdown is not an intraday wick — it is a confirmed structural breach. The prior support level near $0.21, which Martinez had identified in a referenced thread from October 20 as the critical daily close line, has been lost. At $0.2086 at time of writing, ADA is sitting just below that former boundary, which now acts as immediate overhead resistance.
The channel breakdown does not exist in isolation. In the October 20 thread (post 5 of 5), Martinez flagged that ADA’s SuperTrend indicator had flipped bearish — a signal he explicitly anchored to historical precedent. The last time the SuperTrend flipped bearish on ADA was May 22, 2025. What followed was a 46% correction.
The SuperTrend is a trend-following indicator built on Average True Range (ATR). It does not predict direction — it confirms it. When price closes below the SuperTrend line, the indicator flips from bullish to bearish, signaling that the prevailing trend has reversed. A flip is not noise. It is a structural regime change in trend momentum, and on ADA’s chart, it has now aligned with the channel breakdown — two independent signals pointing in the same direction simultaneously. The prior instance of this flip in May 2025 produced a 46% correction; the current setup places the next meaningful downside target at $0.166.
It is also worth noting the broader on-chain context. As covered previously on CoinsProbe, ADA whales had already dumped 110 million tokens as network activity fell 41% — a deterioration in fundamentals that makes the technical breakdown harder to dismiss as a temporary dip. Additionally, LINK, ADA, and SOL had already flashed bearish setups in earlier analyst flags, suggesting ADA’s current breakdown fits a pattern of coordinated technical deterioration across major altcoins.
Martinez’s October 20 thread included an on-chain check on whale holdings in the 100 million–1 billion ADA bracket. His finding: flat over the prior 10 days — no significant accumulation, no significant distribution. At the time, this neutral reading meant neither bulls nor bears had whale-level conviction on their side. The breakdown since then has not yet been accompanied by confirmed whale selling, which Martinez cited as a secondary confirmation signal to watch alongside the $0.21 daily close criterion.
That $0.21 level has now been lost. Whether whales begin selling into this breakdown — or whether they accumulate into it — will determine the pace and depth of the correction. A spike in large-wallet outflows from ADA would validate the bearish scenario; renewed whale accumulation near current levels could slow the decline or produce a relief bounce.
Martinez’s analysis produces two specific numbers that define the trade structure going forward.
$0.220 — The Resistance That Must Hold. This is the level Martinez cites as the critical overhead zone. For the bearish thesis to remain intact, $0.220 must continue to reject price. A daily close back above $0.220 would put ADA back inside — or at least back in contact with — the channel’s lower boundary, materially weakening the breakdown case.
$0.166 — The Primary Downside Target. If $0.220 holds as resistance and the breakdown is sustained, Martinez’s target is approximately $0.166 — a decline of roughly 20% from the $0.220 resistance zone, and approximately 20.4% from current price ($0.2086). This level aligns with a prior consolidation zone from the channel’s early formation phase in late June and early July 2026.
Bullish Scenario — Reclaim of $0.220If ADA reclaims $0.220 on a daily close, the breakdown is invalidated. Price would need to sustain above this level — not merely touch it — to re-engage the channel structure. A confirmed reclaim of $0.220 would shift the near-term bias back to neutral and open the path toward the mid-channel range near $0.24–$0.25. Previously, on-chain data had flagged coordinated spikes across BTC, XRP, and ADA that could complicate directional clarity — making the $0.220 close the definitive arbiter.
Bearish Scenario — Sustained Hold Below $0.220If $0.220 acts as resistance and ADA continues to trade below it, the 20% correction path to $0.166 becomes the primary scenario. A break below $0.195 — the nearest intraday support — would accelerate selling pressure toward that target. The SuperTrend remains bearish unless price closes back above its dynamic line, which currently sits above $0.220.
Cardano’s breakdown from a four-month rising channel, confirmed by analyst Ali Martinez (@alicharts), coincides with a SuperTrend flip that last occurred in May 2025 — preceding a 46% correction. ADA is now trading at $0.2086, below the $0.21 threshold Martinez identified as the breakdown confirmation level. The $0.220 zone is the resistance line: every daily close below it keeps the correction thesis alive. The $0.166 target — approximately 20% below current price — is what Martinez’s framework points toward. Watch $0.220 on a daily close basis as the single level that either confirms or invalidates this breakdown.
Disclaimer: The views and analysis presented in this article are for informational purposes only and reflect the author’s perspective, not financial advice. Technical patterns and indicators discussed are subject to market volatility and may or may not yield the anticipated results. Investors are advised to exercise caution, conduct independent research, and make decisions aligned with their individual risk tolerance.
Also Read: Apple Prints TD Sequential Sell 9 — Last Two Led to 15.66% and 13.63% Corrections