Cardano price rallied as high as $0.190 after whales accumulated 240 million ADA, while a bullish reversal pattern pointed to a possible extension toward $0.208. Summary Cardano whales accumu
Cardano price rallied as high as $0.190 after whales accumulated 240 million ADA, while a bullish reversal pattern pointed to a possible extension toward $0.208.
Summary
- Cardano whales accumulated more than 240 million ADA over five days, according to Santiment data.
- ADA climbed about 22% from its July low before pulling back to approximately $0.186.
- A 4-hour inverse head-and-shoulders pattern carries a potential $0.208 price target.
- Liquidation clusters near $0.193–$0.195 could attract price if buyers reclaim $0.190.
Cardano price trims gains after reaching $0.190
According to data from crypto.news, Cardano (ADA) price traded near $0.186 on Aug. 3 after touching an intraday high of $0.190, extending its recovery from the July 8 low near $0.154.
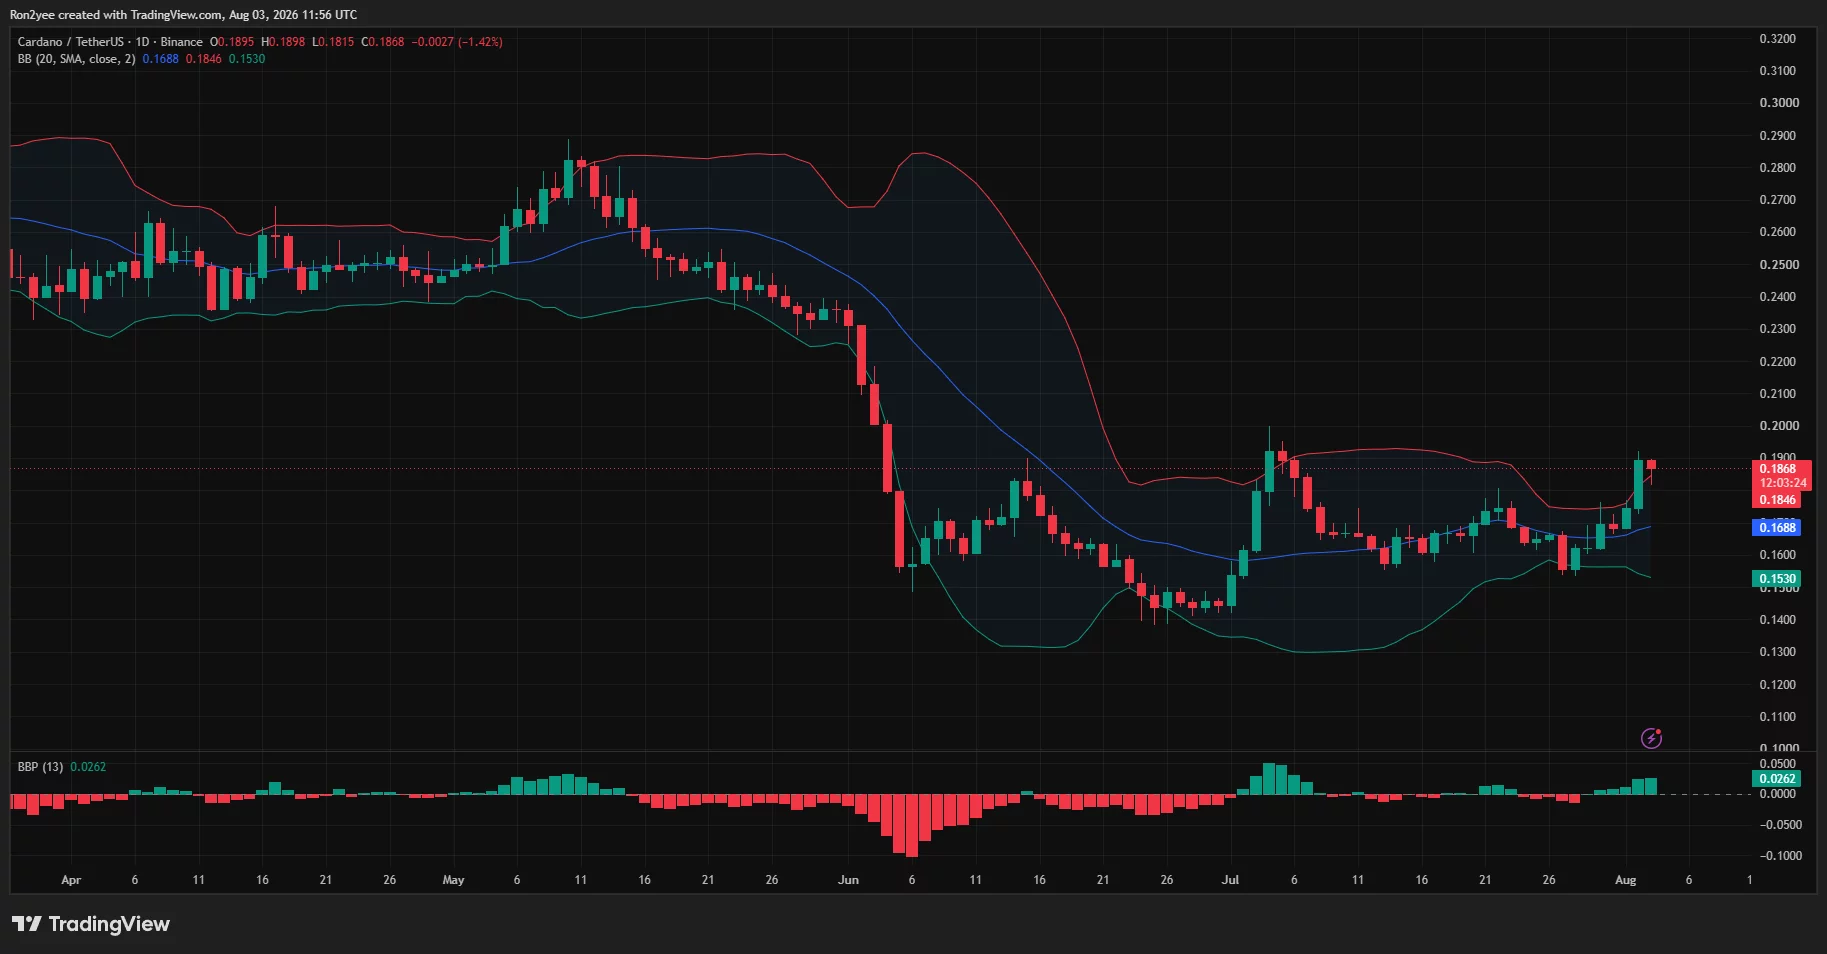
The move left ADA roughly 20% above that floor, although profit-taking emerged after the token tested the upper boundary of its recent trading range. The daily candle was down about 1.4% at the time of the chart snapshot.
ADA’s latest advance also pushed it above the Bollinger Bands’ 20-day moving average at $0.1688. The level had contained several recovery attempts during July and may now serve as medium-term support.
Cardano price daily chart — Aug. 3 | Source:
crypto.newsThe price briefly moved above the upper Bollinger Band, located near $0.1846. Trading outside the band reflects strong momentum, but it can also indicate that the rally has become stretched in the short term.
Bollinger Bandwidth rose to 0.0262 as the bands expanded, confirming that volatility returned after several weeks of consolidation. The increase supports the breakout but also raises the risk of larger intraday reversals.
You might also like: Ethereum price risks $1,700 as support weakens
Whale accumulation helped fuel the ADA rally
Large holders were a central driver of the move. Analyst Ali Martinez cited Santiment data showing that whales accumulated more than 240 million ADA over five days.
“Whales loaded up. Cardano took off,” Martinez wrote.
The reported holdings increased from around 14.1 billion ADA to more than 14.3 billion ADA during the period. That accumulation coincided with a roughly 22% price increase, suggesting that large buyers absorbed supply as ADA recovered.
The rally also followed Cardano’s July 18 protocol upgrade and the network’s transition toward its next development phase. Expectations surrounding future scaling work, including Ouroboros Leios, added a fundamental catalyst to the whale-led move.
Cardano is also approaching six months of CME futures trading on Aug. 9. That milestone could become relevant to prospective US spot ADA exchange-traded fund applications under generic listing requirements, although it would not guarantee regulatory approval.
US traders will therefore be watching whether the futures record strengthens the case for broader regulated ADA investment products. Any ETF progress would still depend on the filing structure and applicable SEC requirements.
ADA inverse head-and-shoulders targets $0.208
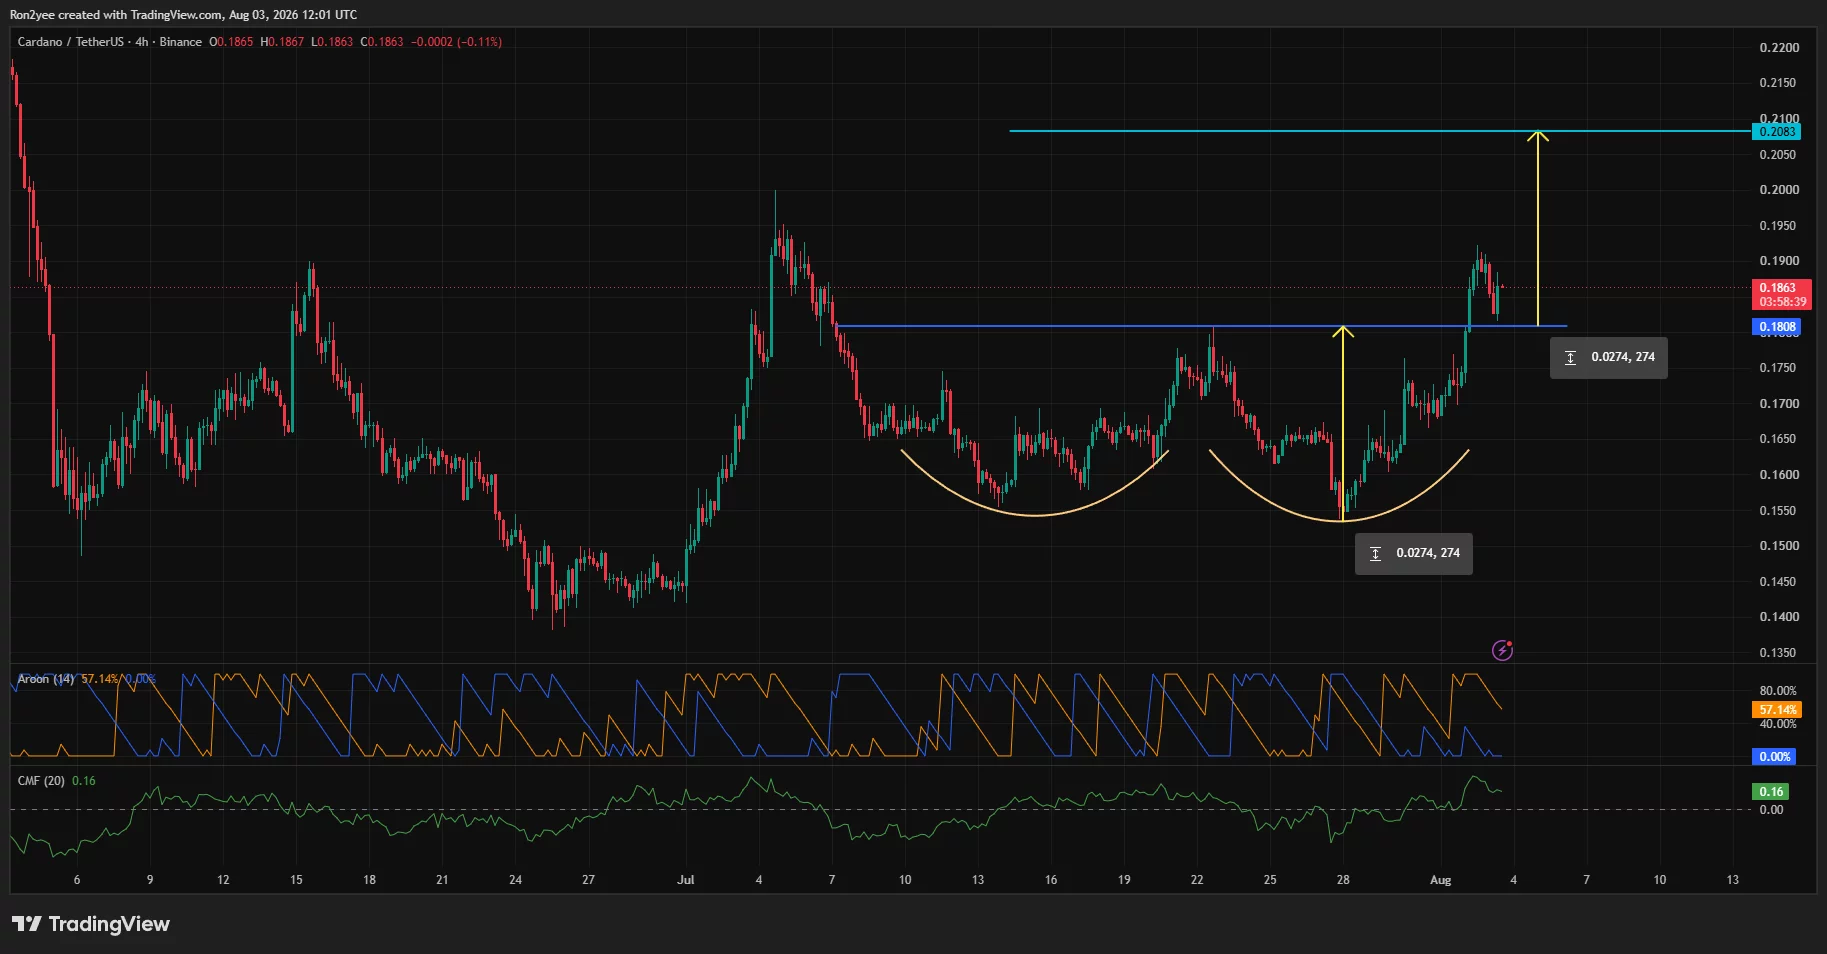
The 4-hour chart shows ADA completing an inverse head-and-shoulders pattern between July 10 and Aug. 2. The formation includes two rounded shoulders near $0.160 and a deeper head around $0.154.
Cardano price 4-hour chart — Aug. 3 | Source:
crypto.newsADA broke above the pattern’s $0.1808 neckline on Aug. 2 and subsequently reached $0.190. The measured distance between the head and neckline is approximately $0.0274.
Adding that distance to the breakout point produces an upside target near $0.2083, about 12% above the current price. A sustained 4-hour close above $0.190 would strengthen the case for that extension.
Money flow remains supportive. The 4-hour Chaikin Money Flow reading stood at 0.16, showing that buying pressure continued to outweigh selling pressure despite the pullback.
However, the Aroon indicator presents a more cautious near-term picture. Aroon Down stood at 57.14%, while Aroon Up had fallen to zero, suggesting that the breakout’s immediate upward momentum was cooling.
Analyst Gerla also identified an inverse head-and-shoulders formation on the daily chart after a bullish RSI divergence played out. That broader pattern places the immediate resistance zone around $0.190–$0.195.
ADA must convert that area into support before the market can target $0.208. Failure to hold the $0.1808 neckline would weaken the bullish pattern and expose the 20-day average at $0.1688.
Liquidation levels could determine ADA’s next move
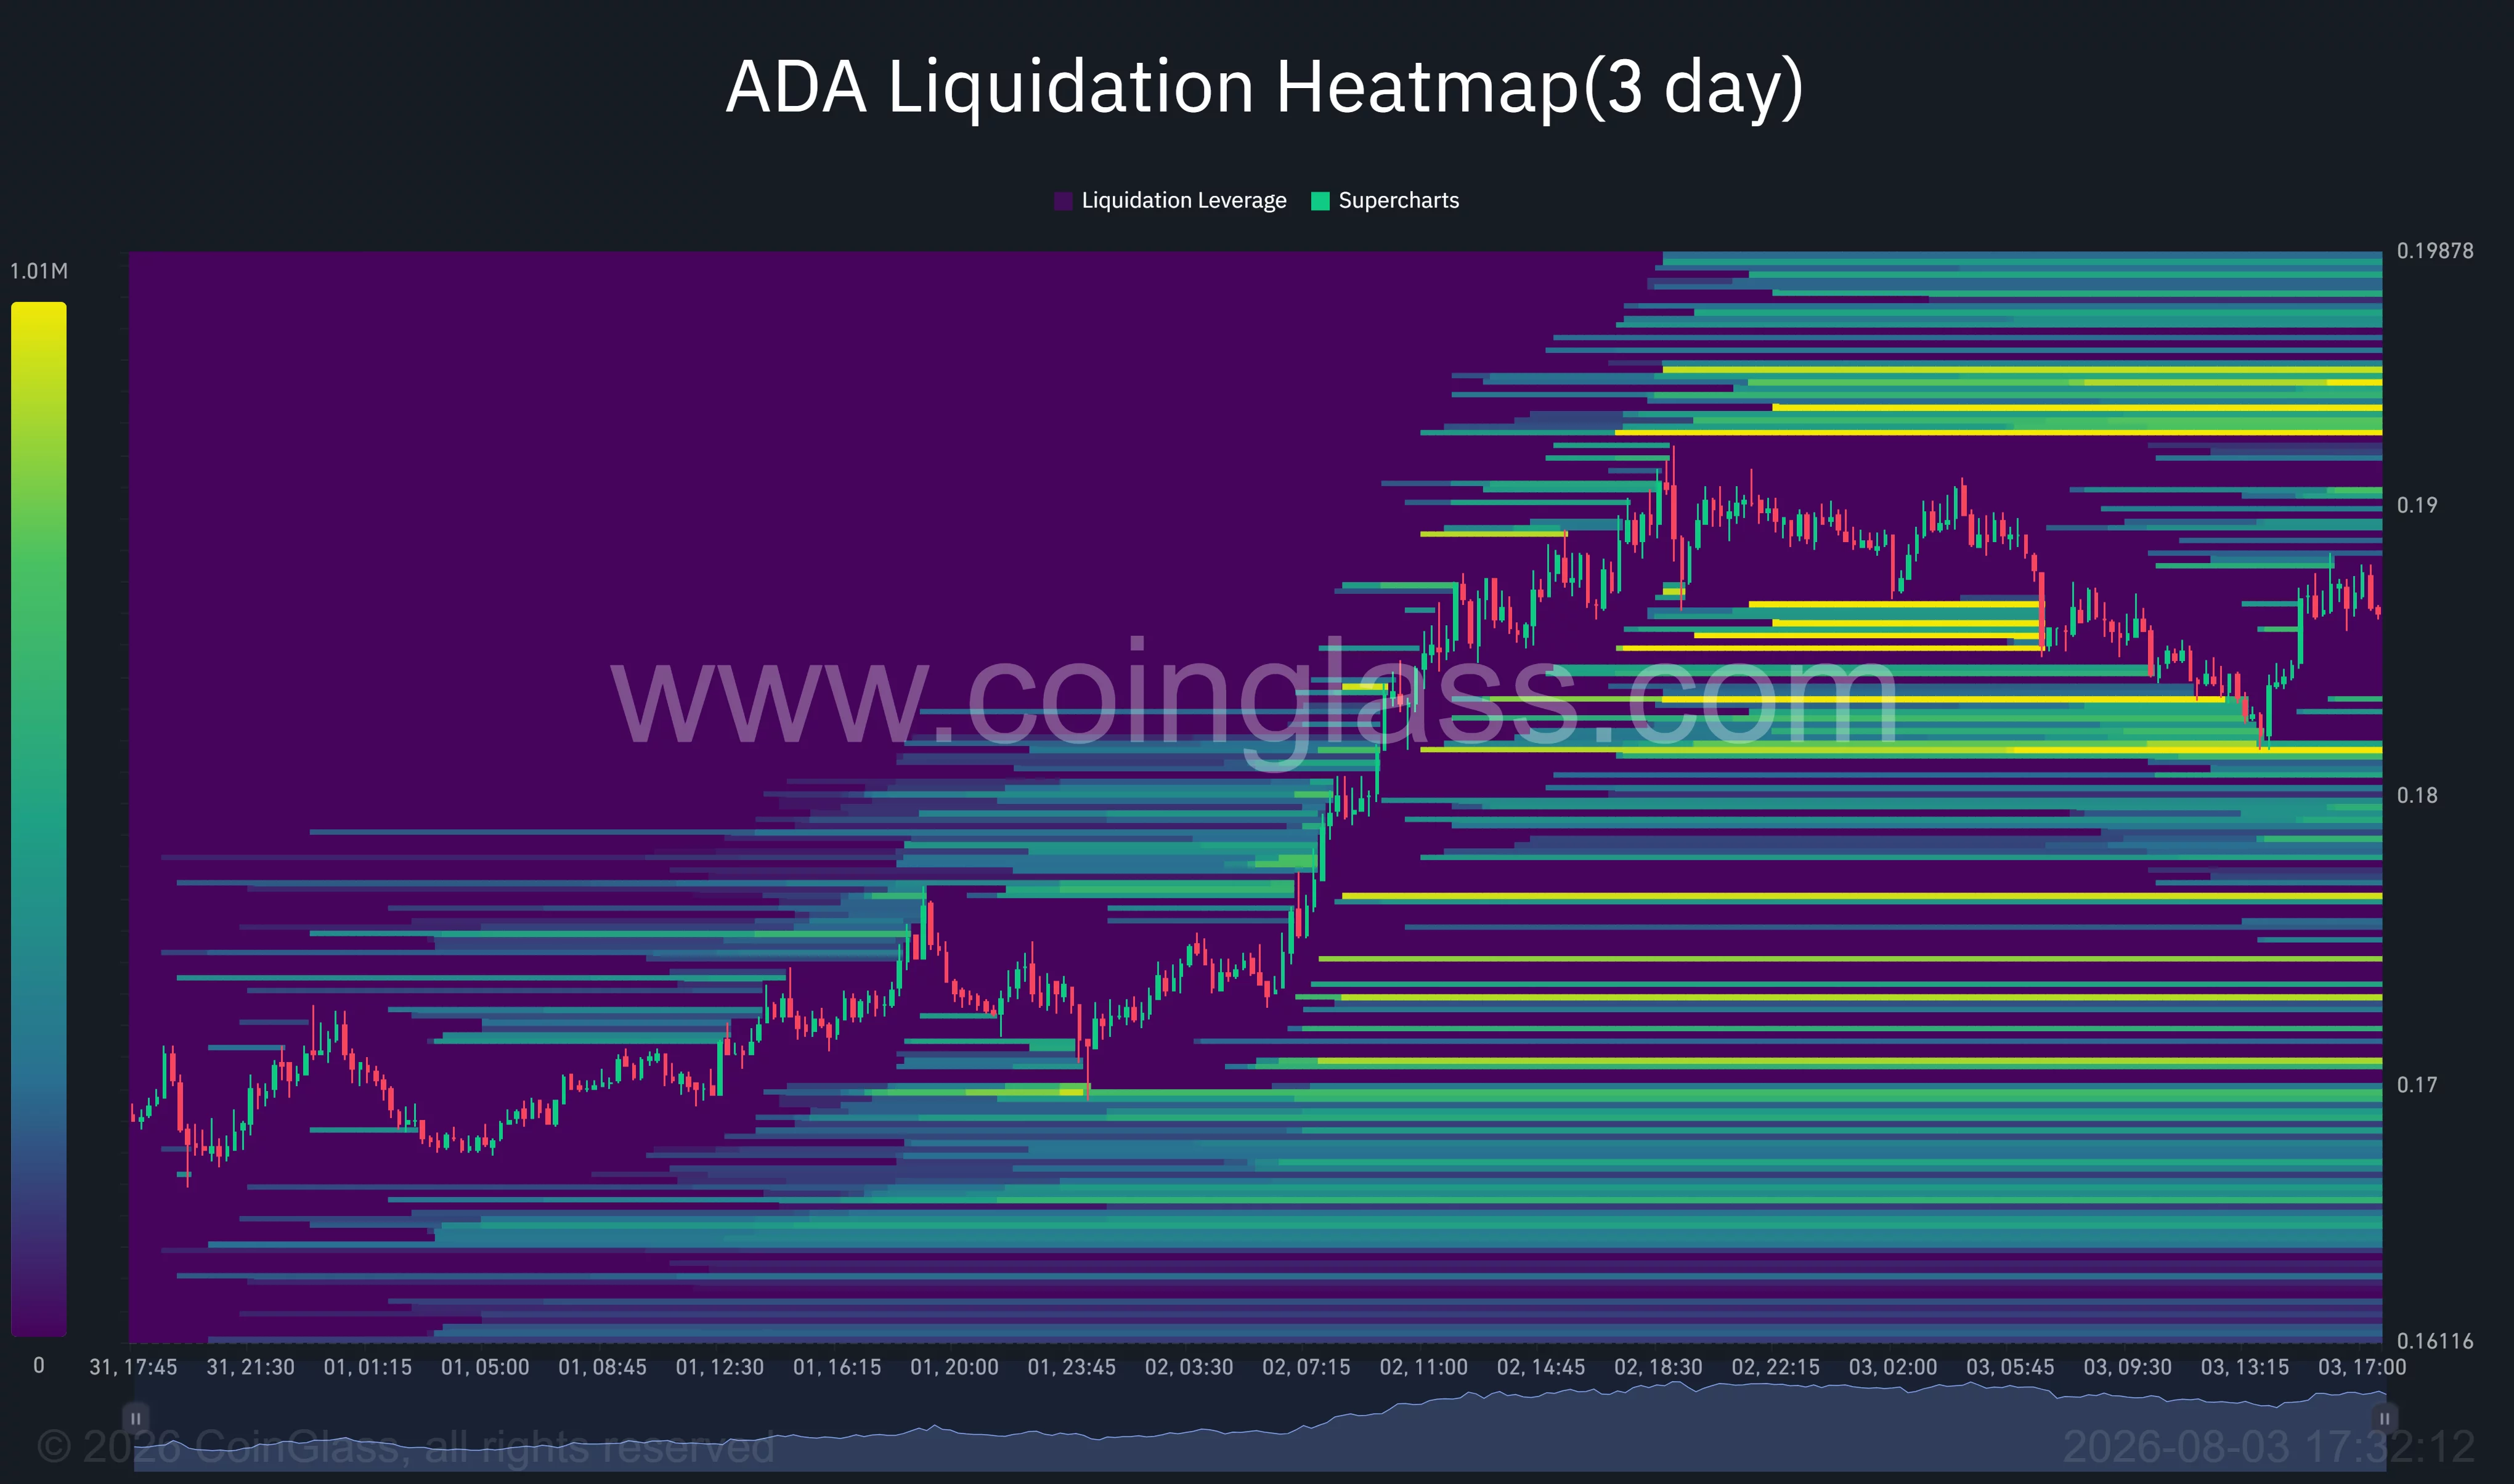
The 3-day liquidation heatmap shows dense leveraged positions on both sides of the current price, creating conditions for continued volatility.
Cardano liquidation heatmap | Source:
CoinGlassThe nearest downside liquidity sits around $0.181–$0.183, close to the inverse head-and-shoulders neckline. A decline into that zone could trigger long liquidations before buyers attempt another defense.
Larger pools of liquidity appear above the market between approximately $0.193 and $0.195. These levels could act as short-term price magnets if ADA retakes $0.190, but they may also generate resistance as short positions are closed and traders take profits.
Additional overhead liquidity extends toward $0.198, while lower clusters are visible near $0.176 and $0.170. This leaves ADA inside a broad leveraged range where a break on either side could accelerate the next move.
The bullish scenario requires ADA to remain above $0.1808 and close decisively above $0.195. That would open a path toward the pattern target at $0.2083.
A close below $0.1808 would indicate that the breakout is losing strength. In that case, $0.1688 becomes the main support, followed by the lower Bollinger Band near $0.153.
Disclosure: This article does not represent investment advice. The content and materials featured on this page are for educational purposes only.
Read more: South Africa proposes reporting rules for cross border crypto transfers