Is the ADA done bleeding, or is this just a breather before another leg down? Buyers lifted ADA to $0.1991 on Nov 5, 2026 at 09:54 UTC, and this Cardano price prediction leans bullish while t
Is the ADA done bleeding, or is this just a breather before another leg down?
Buyers lifted ADA to $0.1991 on Nov 5, 2026 at 09:54 UTC, and this Cardano price prediction leans bullish while the ADA price holds above $0.1962. Sellers ran the tape for weeks, yet a$0.1827 support rebound changed the mood.
Cardano Data Snapshot: What the Numbers Say Today
CoinMarketCap data puts ADA at $0.1990, up 3.79% in 24 hours, ranked 15th with a $7.33B market cap.
Volume jumped 33.79% to $326.11M, so the bounce had real participation behind it.
Supply sits at 36.82B ADA of a 45B max, and FDV (fully diluted value, the cap if every coin existed) reads $8.95B.
But 30 days still show -26.29%, and year-to-date read -40.09%.
Cardano Technical Analysis
30-Minute Chart: Ascending Triangle Under $0.1999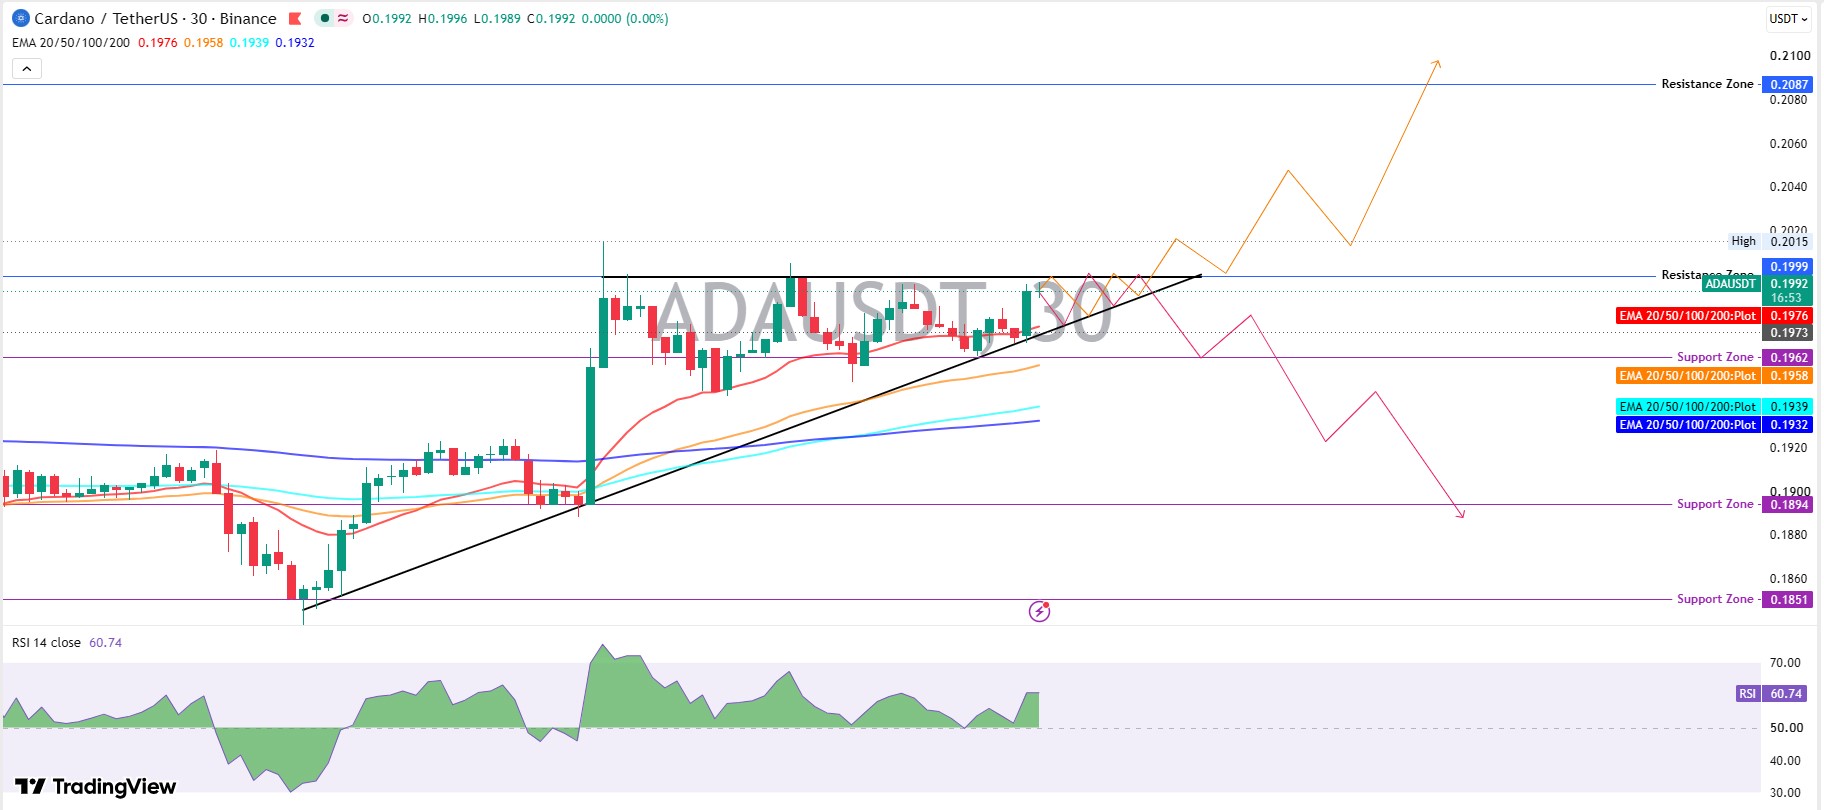
A flat ceiling at $0.1999 and a rising trendline have squeezed the price into an ascending triangle.
Higher lows keep stacking while buyers hit the same wall. On the TradingView chart, the 20 EMA at $0.1976 rises right under price.
RSI at 60.74 backs the push.
Break $0.1999, retest it, and hold it. Then $0.2087 opens.
But a rejection and a slip under $0.1962 flips the script toward $0.1894 and $0.1851.
1-Hour Chart: Buyers Sit Above Every EMA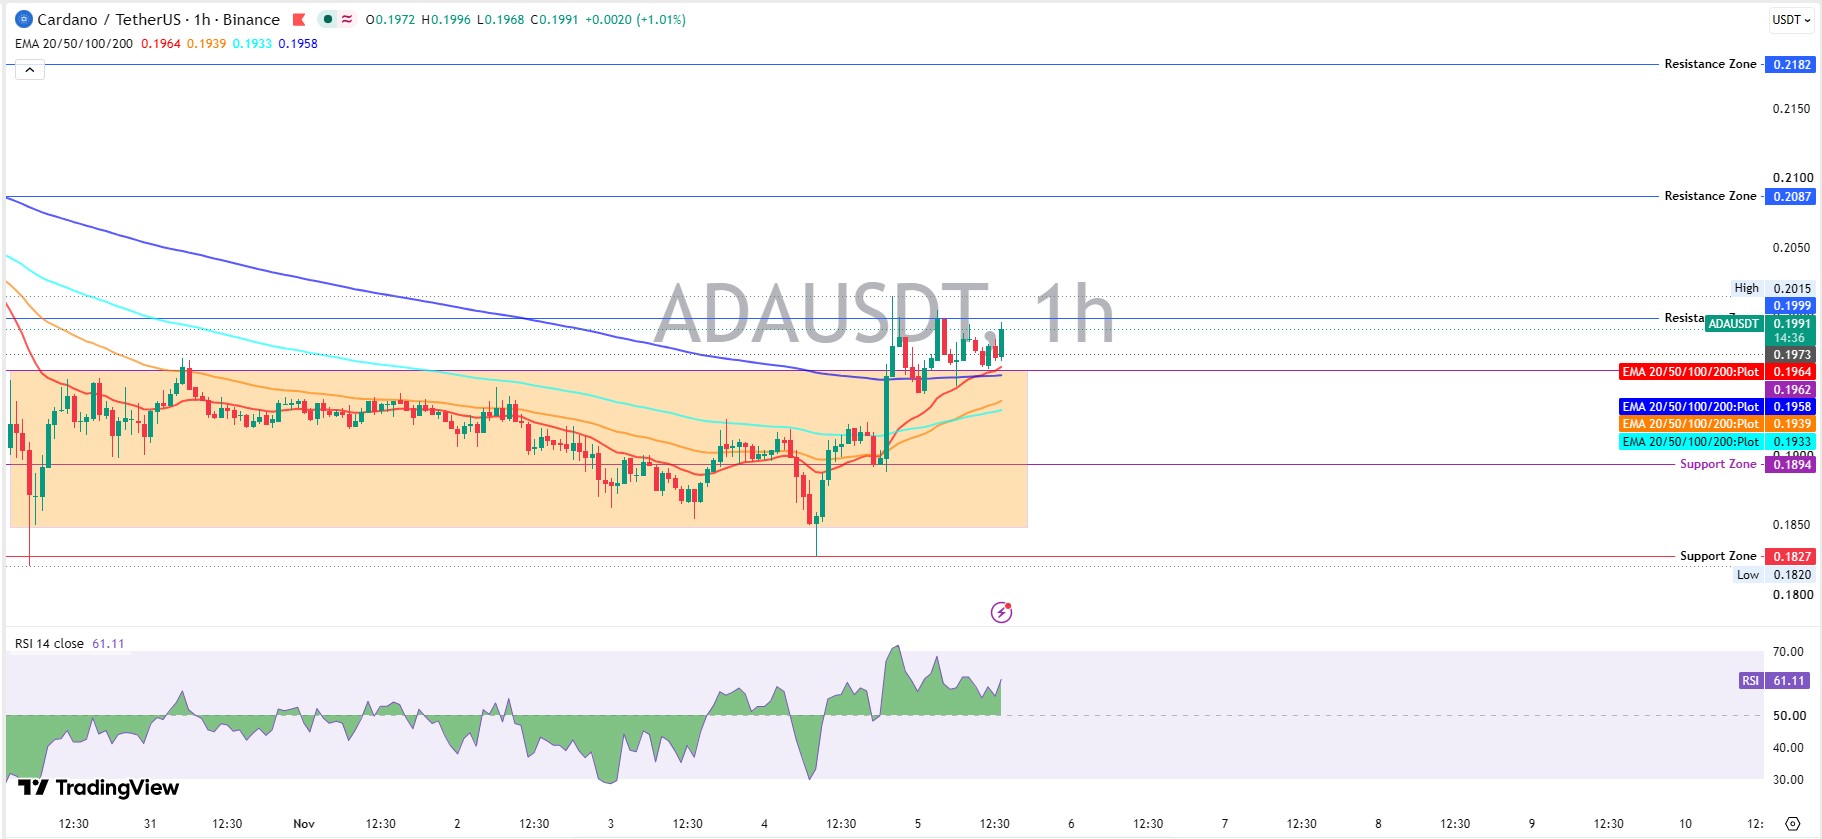
For days, the price stayed trapped under $0.1962. Then on Nov 4, 2026, a single hourly candle spiked to $0.2015.
But buyers couldn't hold above $0.1999, so the price slipped back to $0.1973.
Price now trades above all 4 EMAs, led by the 20 EMA at $0.1964, a lot like the100 EMA reclaim setup.
RSI reads 61.11, down from a spike above 70, so momentum's warm and room remains.
Cardano Price Analysis: Daily Chart From $0.2824 to the Wedge Exit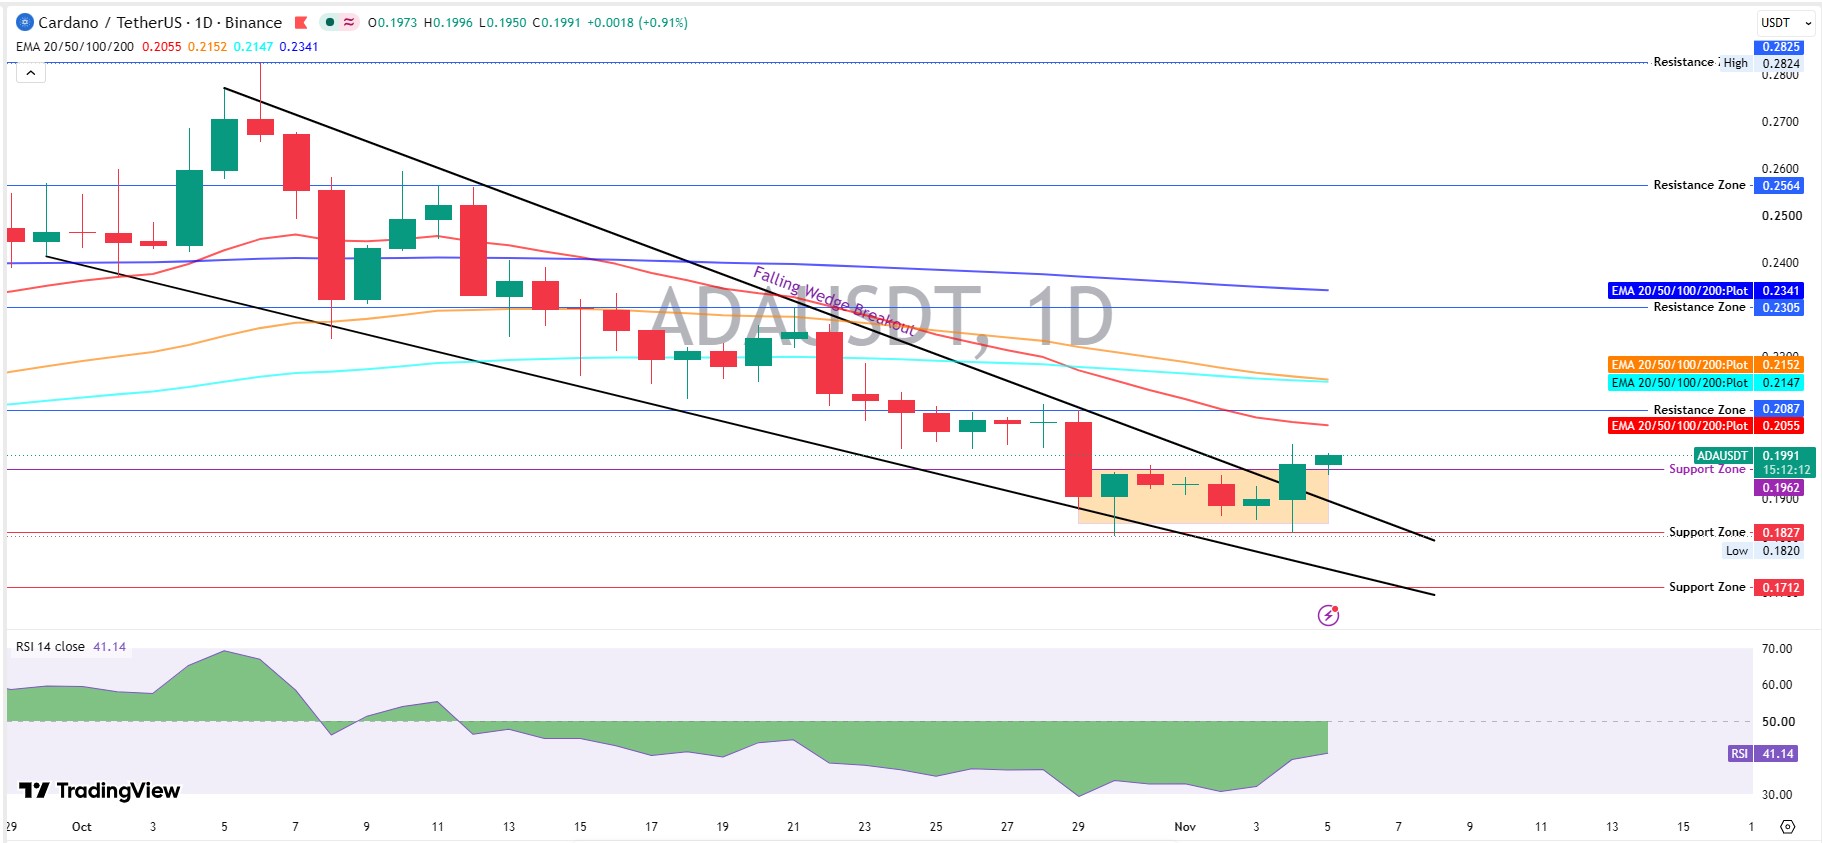
The Oct 6, 2026, daily candle tagged $0.2824, and sellers grabbed control right there.
Price then slid inside a falling wedge, where both trendlines point down but squeeze together. Those often end with an upside break.
Every bounce stalled under the 20 EMA, now $0.2055. An EMA is an average that weighs recent trades more, and the 50 EMA at $0.2152 sits higher still.
Then Oct 29, 2026, brought a large red candle that dropped price into a tight range.
Candles opening Oct 30 and Nov 4, 2026, both wick into the $0.1820 to $0.1827 support zone.
Buyers answered both times, much like thedescending channel near $0.1820 setup.
And Nov 4's candle finally punched through the upper wedge line, a falling wedge breakout that buyers had earned with two defended lows.
Nov 5, 2026, opened at $0.1973, traded between $0.1950 and $0.1996, and now sits at $0.1991.
Daily RSI reads 41.14. That's under 50, and the price still trades under the 20 EMA.
Derivatives Data: Shorts Took the Pain
Shorts got hit.CoinGlass liquidation data shows $1.19M wiped out in 24 hours.
Shorts made up $1.06M of that.
Longs lost just $128.98K. Open interest, the value of live futures bets, sits at $400.74M.
Futures volume of $462.69M dwarfs $68.65M in spot.
Accounts lean long, with a long-to-short ratio of 2.0618 on Binance and 2.37 on OKX.
Crowded longs need price to keep climbing. And a stall at $0.1999 would hurt them first.
Market Backdrop: ADA Moves With the Pack
Bitcoin trades at $80,419.43, up 2.63%, and Ethereum gained 4.17% to $2,413.76.
Solana added 3.82% at $96.59, and Avalanche lagged at 0.85%.
ADA held the floor from its earlier$0.1820 support test, so the 3.79% gain sits mid-pack.
Is that enough to carry the price through $0.1999?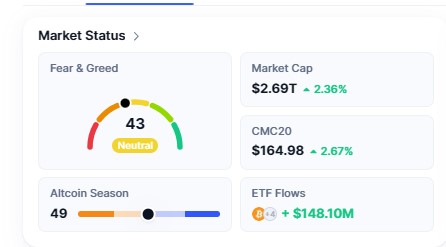
Fear and Greed reads 43, neutral, so nobody's chasing yet. ETF flows show +$148.10M.
On-Chain Pulse: What Cardano's Network Shows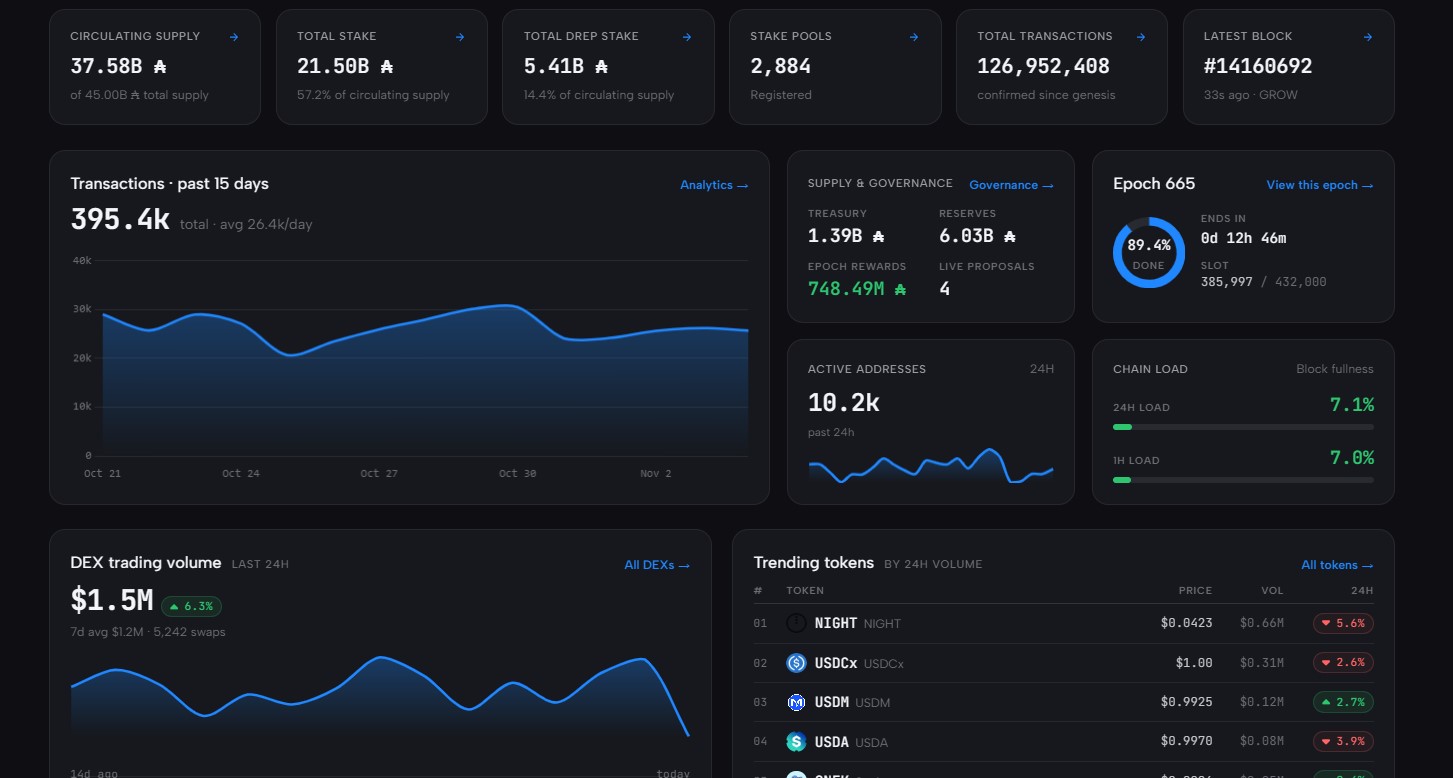
Cardanoscan network data shows 21.50B ADA staked (coins locked to secure the network), 57.2% of circulating supply, so more than half sits locked in staking.
Activity is steady, with about 10.2k active addresses over 24 hours.
DEX (decentralized exchange) volume reached $1.5M, up 6.3% against a 7-day average of $1.2M.
That's tiny next to $326.11M in total ADA volume, so exchange flows drive this move, not on-chain demand.
Cardano Price Prediction: Bull and Bear Paths From $0.1999
This Cardano price forecast maps 2 paths, and therange breakout or breakdown playbook fits both.
If ADA keeps trading above $0.1962, then bulls keep control.
Buyers own this setup. Then again, scratch that, since daily RSI at 41.14 says they're only halfway there.
Scenario
Trigger
Target
Invalidation
Liquidity Condition
Bull
Trades above $0.1999 and holds a retest
$0.2087, then $0.2182
Trades under $0.1962
Volume above the $326.11M daily level
Base
Chops between $0.1962 and $0.1999
$0.1973 to $0.1991
Breaks either edge
Futures volume stays near $462.69M
Bear
Rejected at $0.1999, then slips under $0.1962
$0.1894, then $0.1851
Trades back above $0.1999
Long liquidations rise past $128.98K
Key Levels to Watch
Cardano Price Outlook: Support Ladder
Support runs $0.1962, $0.1894, $0.1851, and $0.1827, with $0.1712 as the daily floor if the range fails.
Resistance Ladder
Resistance starts at $0.1999, then $0.2015, $0.2087, and $0.2182. The200 EMA resistance at $0.2341 on the daily chart sits far above.
Risks That Can Flip the Setup
Any Cardano price projection has to respect crowded longs, because a rejection at $0.1999 sends the price toward $0.1962 fast.
If Bitcoin rolls over from $80,419.43. Altcoins usually feel that first.
But the daily trend remains the weak spot, and thelonger monthly view needs a reclaim of the 20 EMA at $0.2055.
Final Verdict
This Cardano price prediction stays bullish above $0.1962, with $0.1999 as the gate and $0.2087 as the first target.
A trade under $0.1962 flips the bias.
Disclaimer: This article is for information only and isn't financial advice. Crypto markets move fast, and prices can reverse without warning. Readers should research independently and manage risk before trading.